

In college football, loudmouth legacy programs climb to the top, the easy-schedule teams try to avoid controversy, and the underdogs claim they belong in the big leagues. The Bowl Championship Series system and various “polls” try to put them in order. But really, there’s no definitive way to rank the teams or decide who goes to the championship game.
The same could be said of trying to rank the now 17 candidates for the Republican presidential nomination.
Since 17 people answering questions is way too many for one stage, Fox News is splitting the field for its Aug. 6 debate -- the first of the primary season. The top 10 ranked candidates get prime-time. The rest get a much less favorable time slot. The problem is that Fox is using polls to make the cut, and that's as questionable as the pre-playoff BCS bowl selections.
The top 10 candidates will be determined by averaging their support among Republicans in the last five Fox-approved national polls. But with 17 candidates, the numbers are pretty close together -- often within the polls' "margin of error."
And averaging the results of five polls doesn't really help. In fact, it introduces a different error.
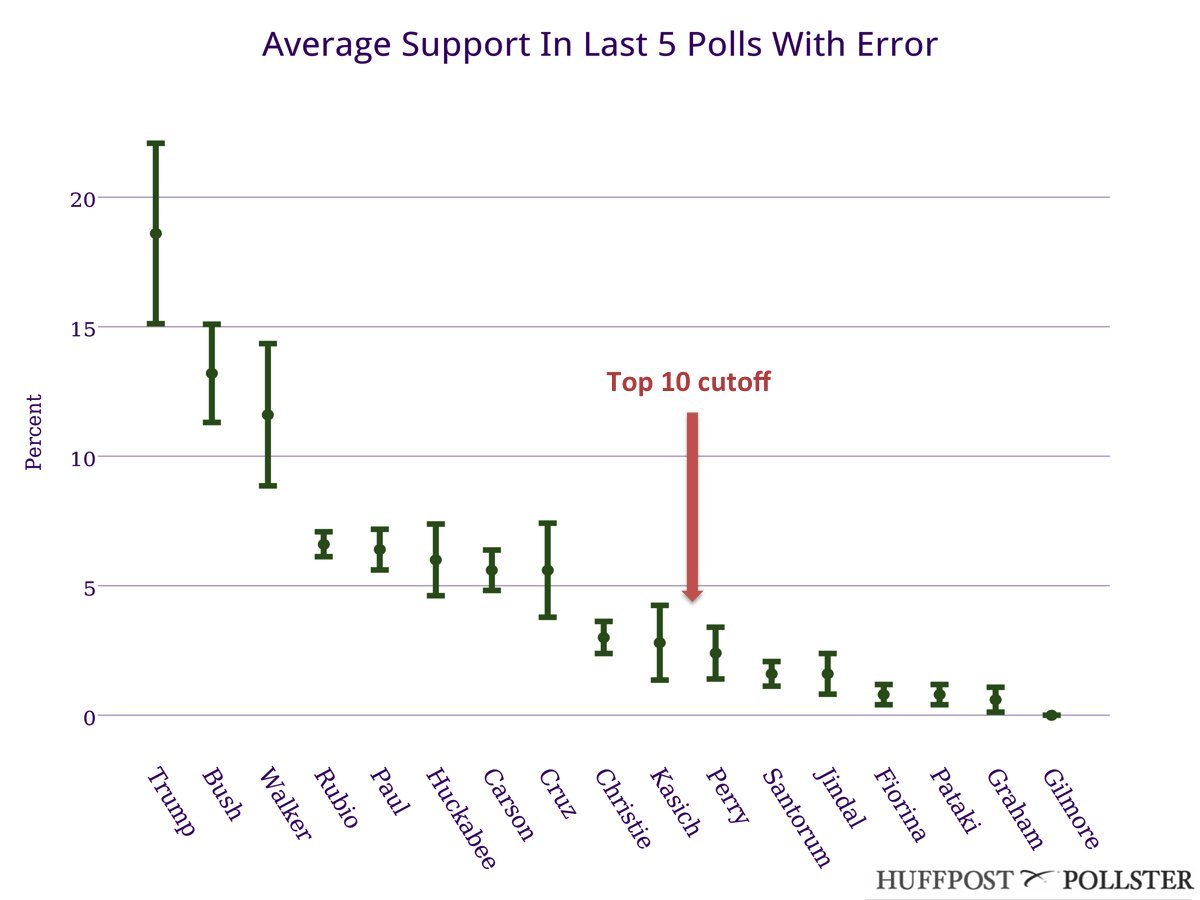
The current candidate rankings based on a five-poll average look something like this (hang on, we'll explain below):
To create this chart, we began by trying to determine the surveys that Fox News is likely to use. Fox has said these polls will come from "major nationally recognized organizations that use standard methodological techniques,” which usually means telephone (both landline and mobile) polls done by live interviewers. As of July 31, the most recent five in the HuffPost Pollster database that fit these requirements are the Quinnipiac poll conducted July 23-28, the CNN poll conducted July 22-25, the ABC/Washington Post poll conducted July 16-19, the Fox News poll from July 13-15, and the Monmouth poll from July 9-12.
Next, Fox said it will calculate an average for each candidate from those five polls. However, just as polls have error, polling averages have error. It’s actually fairly simple to calculate the range of that error. (Information on those calculations appears below for the statistically minded readers.)
The green dots on the HuffPost chart show the five-poll average for each Republican candidate. The short green lines extending above and below the dots show what we call the "confidence interval" for that dot: If we could take 100 averages for a candidate from an unlimited number of polls, 95 of them would fall somewhere along the line, so the line represents 95 percent of the error expected from using only those five polls. The "true" average support for each candidate is more likely to be at or near the dot than out further along the line, but it could be elsewhere.
Real estate mogul Donald Trump and Wisconsin Gov. Scott Walker have longer lines (and more error) because their support varied more across the five polls. Others have short lines because most of the polls showed them in about the same place. The newest entrant into the race, former Virginia Gov. Jim Gilmore, has no polling at all and therefore is stuck at zero with no error.
Where two or more error lines "overlap," there’s a possibility that those candidates have the same average support. The more the lines overlap with each other, the stronger the possibility that those candidates might have the same average.
There’s a lot of overlap happening in this chart. While Trump is out in the lead, former Florida Gov. Jeb Bush almost completely overlaps with Walker. That means there’s about a 50 percent chance that Bush and Walker are tied. Florida Sen. Marco Rubio is most likely not close to Trump, Bush or Walker, but he could be tied with Kentucky Sen. Rand Paul, former Arkansas Gov. Mike Huckabee, neurosurgeon Ben Carson and Texas Sen. Ted Cruz. That's a five-way contest that can't be sorted out using averages.
Still, all those candidates appear to be safely in the top 10. Of more consequence for the debate, there's another five-way race for the last two slots.
Among New Jersey Gov. Chris Christie, Ohio Gov. John Kasich, former Texas Gov. Rick Perry, former Pennsylvania Sen. Rick Santorum and Louisiana Gov. Bobby Jindal, it's nearly impossible to tell who should be in eighth place and who should be in 13th. But only two of them will make it to the prime-time debate. Kasich and Perry, numbers 10 and 11, are almost certainly tied.
The mess around the Fox debate is probably worse than the annual BCS snafu at the end of the college football season. It’s closer to trying to figure out who should get bowl games halfway through the season. There are lots of contenders, lots of upsets left to happen, and critical decisions about to be made with very little information.
More about methodology:
For each candidate, the average, standard error and confidence interval were calculated from the five polls listed above. The standard error provides a measure of how accurately the average of just these five polls judges a candidate's support if we could compare it to an unlimited number of polls that represented all Republican voters. Using basic statistical principles, if the standard error is multiplied by 1.96 and added to the average, we get the upper half of the 95 percent confidence interval. By multiplying the standard error by 1.96 and subtracting it from the average, we get the lower half of the confidence interval. All together, these numbers provide the range within which the average would fall 95 percent of the time if we had an unlimited number of polls to consider.