Dan Hopkins's article "Partisan Loyalty Begins at Age 18" at Five Thirty Eight (April 22) offered an interesting lens through which to view the current trend of the youngest voters leaning Democratic and the oldest ones leaning Republican. The year someone turned 18 had a potent effect on 2012 partisanship, according to Hopkins, even for cohorts that turned 18 roughly 60 years before the 2012 contest. The effect stems largely from the formative influence of the competence or incompetence of the incumbent president when an individual reaches the voting age [1], according to the argument.
While reading the Hopkins article, I became curious (as did many people who left comments on the article) as to exactly how stable political affiliations instilled at (or around) age 18 were, as these voters passed through their 20's, 30's, 40's, and so forth into later adulthood. Fortunately, outlets such as The New York Times (1980-2008, 2012) and Washington Post (2012) have archived exit-poll results for several of the last presidential elections [2], allowing us to follow the voting behavior of different cohorts over time. Note that the results I'm about to present are in aggregate form (i.e., percentages of broad age groups that voted for one party or the other in a given election), rather than at the individual level, which probably would inform us more about the specifics of who was changing their mind.
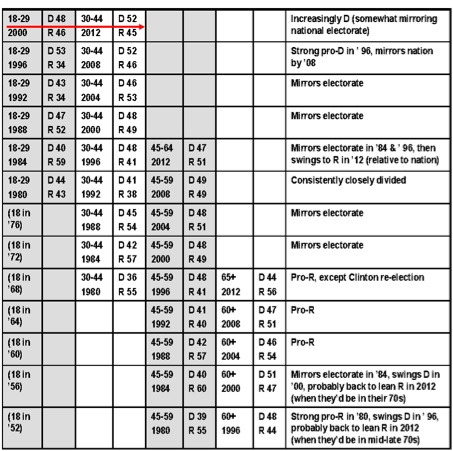
In the following chart, I have compiled voting trends over time for 13 different age cohorts. The youngest cohort -- individuals who were 18-29 in 2000 -- is listed in the top row. Each cohort is followed at either 12- or 16-year intervals, so results for the youngest cohort are listed again when this group was 30-44 in 2012 (the red arrow illustrates this continuity). A verbal description of the voting trends for each cohort is given in the right-hand column. Because of my decision to revisit each cohort at 12- or 16-year intervals, the voting results of 18- to 29-year-olds in 2004, 2008, and 2012 would not yet have follow-up years and are thus not included. As one goes down the chart, the cohorts get older, ending with individuals who would have turned 18 in (roughly) 1952.
Consistent with conventional wisdom, the youngest cohorts appear more Democratic-leaning than the national electorate as a whole, whereas the oldest cohorts appear more Republican-leaning. The middle cohorts, age-wise, tend to mirror the electorate, showing no clear trend toward favoring either party.

Let's walk through a couple of examples. The youngest cohort (18-29 in 2000) favored Al Gore over George W. Bush that year by a 48-46 percent margin, nearly replicating the overall popular vote that year. Twelve years later, this cohort (whose ages now largely coincided with the 30-44 age group in the 2012 exit polls) favored President Obama by seven percentage points over Mitt Romney (52-45), a slightly larger margin than Obama enjoyed in the overall electorate (51-47). This cohort thus maintained -- or even increased -- its Democratic preference from 2000 to 2012.
Let's also examine one of the older -- and more GOP-leaning -- cohorts, those who turned 18 around 1960 and would have been approximately 70 in 2012. In 1988, these voters (who would have fit into the younger portion of the 45-59 age group that year) favored the elder Bush (George H.W.) 57-42, a much wider margin than his 53-46 overall popular-vote victory over Democrat Michael Dukakis. In 2004, now represented by the 60-and-older age group, these voters went for Bush's son by 54-46 (compared to 51-48 for the entire electorate).
Hopkins's formative-years hypothesis does not explain all the results, however (not that he ever claimed it did). Some of the cohorts have more "zig and zag" than the formative-years hypothesis would imply. The oldest cohort (which turned 18 around 1952) was certainly pro-Republican in 1980 as 45-59-year-olds, delivering Ronald Reagan a whopping 55-39 advantage over incumbent Democrat Jimmy Carter (compared to 51-41 in the full electorate). Sixteen years later (when the group would fit the 60+ category), however, these voters favored the re-election of Democrat Bill Clinton. In 2012, this group would have been in its mid-late 70s; according to Hopkins's graph (which measures 2012 party identification rather than vote), these voters would have gone back to being comfortably Republican in their affiliation. Thus, even a long-term partisan affinity (perhaps owing to formative experiences around age 18) can be derailed for a time, as when an incumbent of the other party is enjoying an easy reelection (as was Clinton in '96).
Notes
[1] The voting age was lowered from 21 to 18 in advance of the 1972 election. Still, the age of 18 could have held psychological significance for following politics even before 1972, as an 18-year-old would have graduated high school and entered either college, the workforce, or the military, any of which could heighten one's interest in political issues.
[2] The 2012 exit-poll displays are heavily similar for the Times and Post, except that the Post provided shares of the vote for both the winner and loser within particular demographic subgroups, whereas the Times provided only the winner's share. Because of minor-party candidates, the loser's share would not necessarily be 100 minus the winner's share, so the Post's display for 2012 was preferred.