
*NOTE: This five-year period covers 2010 through 2014, the last available data.
There has been a good deal of movement regarding the hidden networks known as 'special access'. They are not special; they are just basic business broadband and data lines that use the existing copper (and fiber) utility networks.
FCC: What is Special Access?
For example, the Consumer Federation of America (CFA) released a new report on April 5th, 2016 on special access overcharging and economic harms.
"(CFA) today released a study that estimates that large incumbent telephone companies have engaged in abusive pricing practices for high-speed broadband 'special access' services, with overcharges totaling about $75 billion over just the past five years. As a result, CFA estimates that the indirect macroeconomic loss to American consumers doubles that damage to a total in excess of $150 billion since 2010."
The study brings up some good points. However, the overcharging for these special access services, as reported by the CFA, is only a fraction of the financial accounting manipulations that have been going on since 2000, and the report didn't address the fact that the obscene profits of special access are being created through massive cross-subsidies -- the overcharging of special access was created, not simply by the neglect of the FCC and the lack of competition, but through one of the largest accounting scandals in American history.
And it impacts every service and current policy decisions, from the raising of local rates, the shutting off of the copper infrastructure to force-march customers onto wireless, (which has been subsidized via local phone rate increases, as the wires to the cell towers are part of these 'special access' networks), or the price to competitors and end users who rely on the incumbent utility networks.
Let me summarize some of the work we previously released about special access and cross-subsidies - and throw in some new material which will be detailed in our upcoming reports from the series "Fixing Telecommunications".
A $60 Billion Market; $31.6 Billion in Mostly-Copper, Regulated Revenues in 2014.
Back in July, 2014, we published an article and detailed how the FCC's data and industry analysis was off -- big time. The FCC claimed that special access was a $12-18 billion market in 2013 originally.
In 2014, we found that special access 'regulated' revenues were about $28.3 billion but in toto was actually over $60 billion, as there is a collection of financial buckets for special access, much of which was NOT counted and NOT part the original FCC financial analyses. (NOTE: We did a slight recalc based on Verizon NY 2014 Annual Report data, and other Verizon state annual report data we obtained.)
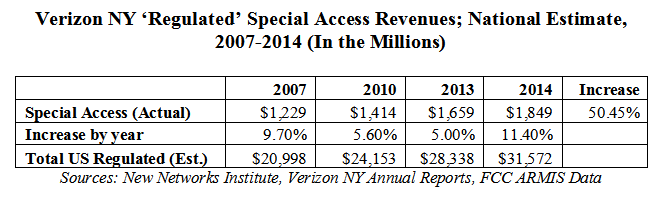
By 2014, special access revenues had increased 50.4% since 2007, (the last FCC recorded data) and it had reached $1.85 billion, surpassing 'Local Service' revenues. (The upcoming reports give the details through 2015.)
We estimate that in 2014, special access regulated revenues was $31.6 billion.
"Black Hole Revenues" are Filled with Special Access Revenues
Our previous and new reports go into detail about "Black Hole Revenues". When we cross-referenced different financial reports for Verizon New York, we found that there was a massive difference. In 2010, Verizon NY showed $2.3 billion in extra revenue on the Investor-SEC-filed books vs the NY Public Service Commission (NYPSC) required annual report -- with no explanation. However, it is clear that various access revenues are NOT on the regulated financial accounting, but are in different financial buckets, including an area called 'nonregulated', and others that are on different accounting books.
This is a serious problem because in 2010 we found that the 'construction expenditures' in the SEC books were the same as the regulated utility books - i.e., the $2.3 billion in revenues (and access revenues) paid no extra capital expenditures.
Using the 'Black Hole' accounting, we estimated that special access was over $60 billion. (See "Fixing Telecommunications" for more details.)
However, the $31.6 billion for 2014 represents mostly copper-based revenues for the Bell companies - Verizon, AT&T and Centurylink, and the independent ILECs who control most of the copper incumbent networks. We believe that the 'copper-based regulated' special access is overwhelmingly controlled by these three companies, however, and this projection reflects mostly their revenues.
The FCC Released Special Access Info Is Lacking.
In 2015, the FCC released new info based on its data collection, claiming that the market was really $40 billion in 2013 and that 60%, the majority, was $24 billion in 'mostly copper' networks. While it appears to dovetail with our analysis, there's a problem.
The FCC, however, appears to have based their market size on their data collection. According to recently un-redacted info, AT&T's consultants claim that 42% of the data is missing.
"Building-specific revenue data are lacking for about 42 percent of all buildings in the 2013 Special Access Data Collection, including 51 percent of CLEC locations and 27 percent of ILEC locations."
NOTE: However -- If we add 42% to the FCC's original $40 billion, it ends up being $57 billion and closer to our analysis.
I'll get back to how to solve the actual size of this market and it isn't what the FCC is doing today.
Manipulation of Financial Accounting - Charging Local Phone Customers for Special Access Deployment in Multiple Ways.
Let me give you specific examples that demonstrate the massive cross-subsidies in play.
The FCC's "Big Freeze" Manipulated the Financial Books to Make Local Service Pay the Majority of Expenses.
In 2001, the FCC created a series of regulations on how expenses were to be allocated - and literally 'froze' the analysis to always be based on the year 2000 -- yeah, 16 years ago. (And it is in effect today, regardless of what the companies say, including using words like 'price caps'.)
We use Verizon NY because it is required to supply financial annual reports to the NY Public Service Commission (NYPSC).
The incumbent utility financial accounting books are divided in three main categories-- 'Access Services', 'Local Service' and 'Nonregulated'. We will focus on access and local service, and go though nonregulated revenues, etc. in a future article.
'Corporate Operations' Expenses Dumped into Local Service
Here it is in black and white. This chart shows 'Corporate Operations' expense by year as compared to revenues of Local Service. These are expenses for lawyers, lobbying, etc., a virtual garbage pail of corporate charges, it appears.
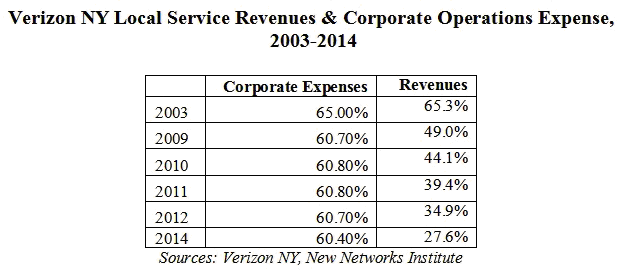
As you can see, Corporate Operations expenses remained virtually the same each year, but Local Service revenues were in decline. In 2003, Local Service revenues were 65% of the total regulated income and paid 65% of the expenses; by 2014, Local Service was still paying 60% of the expenses but only had 27.6% of revenues.
Access Services paid 29.5% of this expense, but had 45.1% of the revenues (special access being 82% of Access Services in 2014).

Special Access Paid a Fraction of Network Costs: 'Grandma' Funded Special Access.
And in every category, Local Service ends up paying the majority of expenses.
In this next example, Verizon NY's Local Service had 65% of revenues and paid 62% of the network expenses in 2003; Access made 31% and paid 30%. (This includes what is known as "Plant Specific" and "Non-Specific Plant" expenses.)
By 2014, Local Service is 28% of revenues but was paying 46% of network expenses. Access Services, was 45% of revenues in 2014, but only paid 24% of expenses.

Local Service is 'POTS', plain old-copper-based telephone service, of which Verizon has more or less stopped maintaining much less upgrading the copper infrastructure - but it is paying $1.5 billion, even though local revenues in 2014 were $1.4 billion.
There's been no audits, no investigations, and the FCC's new data doesn't actually go into the financial accounting to find these massive cross-subsidies - i.e., Grandma, low income families, small business customers all had rate increases, and with these cross-subsidies are paying for Verizon's special access profits as well.
Verizon Wireless Appears to be Paying Below Market Prices for Competitors, and Cross-Subsidized the Special Access Wires to the Cell Towers.
But it gets worse. Besides not paying common costs and dumping the majority of expenses into Local Service, it appears that Verizon's 'affiliate companies', like Verizon Wireless, are paying a fraction of what other competitors pay for the same service.
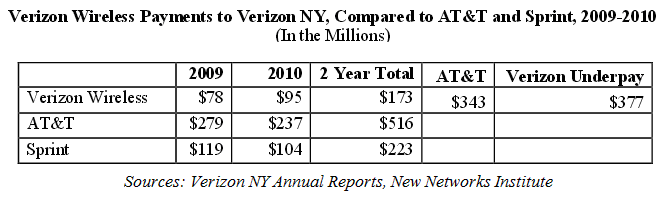
This information was reported in Verizon NY's 2009 and 2010 SEC-filed 4th quarter reports, and was highlighted in our previous reports. Sprint and AT&T are paying a lot more than what Verizon Wireless was paying for "access fees" and "billing and collections" to Verizon New York, the incumbent phone company.
In fact, Sprint paid more than Verizon in both years and had at least ½ the customers, while AT&T was about the same size. There is no information supplied as to whether these are identical payments for the same services rendered or different, but on the surface, Verizon Wireless was paying a fraction of what other competitors pay for the same service.
(This is from "It's All Interconnected", published by Public Utility Law Project, PULP, May 2014. We will be updating this information, summer 2016.)
Re-Engineering the Expenses: Massive Cross-Subsidies
Here is what the calculations would look like if 'Access Services' paid expenses based on revenues as opposed to the manipulation of applying the expense allocations of the year 2000 (with caveats; we left out "nonregulated" services, for example.)
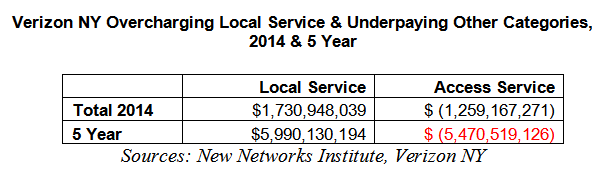
Simply put, in just 2014, Verizon New York's regulated Access Services underpaid $1.3 billion in expenses while Local Service overpaid by $1.7 billion, and each expense category had major overcharging of Local Service.

Examining this over 5 years, 2010-2014, Access Services underpaid by $5.5 billion in just Verizon New York while Local Service overpaid by almost $6 billion (this was based on actual accounting per year).
And nationwide, this would mean that annually, Access Services are underpaid by about $18 billion and Local Service had been gouged by $24 billion dollars - in just 2014. Over these five years, 2010-2014, Access Service fees underpaid by $88 billion and Local Service was overcharged at least $121+ billion.

'Minutia Analysis': Doubling-Down on Overcharging
There are caveats that make this a lot worse; many of the expenses charged to Local Service should not be charged and the totals would need to be adjusted.
Case in point, Local Service paid 52.6% of Marketing & Advertising expense, which is made up of $230 million of 'product management' with 'other expenses' and $112 million in 'product advertising'.
This means that Local Service paid about $180 million for Marketing/Advertising in just 2014.
When is the last time you saw an advertisement for basic phone service? Even if we adjust this category to the revenues, where Local Service paid 27.6%, that still comes to $94 million of expense -- in just New York. Obviously, this expense should be bordering on zero, as should, say, paying for network construction that isn't being done or 'corporate operations'. And to top it off, since 2006, Local Service had multiple rate increases based, in part, on these expenses that created financial losses.
Manipulation of Access Line Accounting
We've written a lot recently about the fact that Verizon et al. have manipulated the accounting of access lines to make it look like Local Service is unprofitable and 'losing lines'.
Yes, "Local Service" is losing revenues -- some of it being migrated to other services that are not in this accounting if it is considered "IP" or 'inter-state', or when a line is no longer treated as an access line, such as the addition of DSL or any other 'information service'--or used as a special access lines. And there is a question about whether a Verizon Wireless service should also be counted, especially when not only the service, but the connection to the towers, are all from Verizon.
And yes, there has been a drop in one category of lines, 'POTS' phone service.
But, here's the problem. This is just one subset of lines, and other areas, like special access, had massive increases.
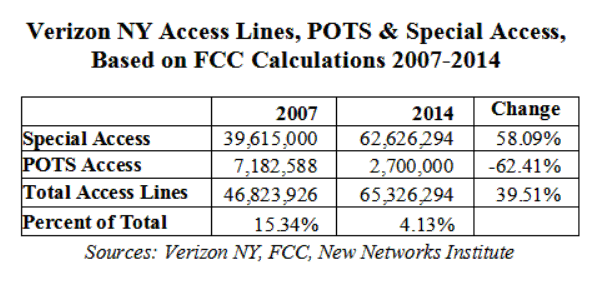
This is from the FCC's last report covering access line accounting - "Statistics of Common Carriers", and it shows that in Verizon New York territory there were 47 million total access lines in service in 2007 (with caveats).

In 2014, Verizon claimed it had 2.7 million access lines, and doesn't mention any of the special access lines, DSL lines, lines to competitors, wires to the cell towers, etc.
If special access revenue went up 50% since 2007 as documented by Verizon New York's Annual reports, then how can Verizon claim access lines are going down?
In fact, we estimate that there are about 65 million total access lines in Verizon NY, starting with the FCC's own published data as the guide.
How can Verizon shut off the POTS networks claiming that they are losing lines or that the networks are unprofitable, when we just saw a massive manipulation and multiple cross-subsidies, underpaying by affiliate companies and other financial tricks?
As we pointed out in a previous article -- special access wires and the local phone service wires are the same, identical wires. Why is one class of wires being hidden?
Solution: What is ridiculous is - the FCC could have simply required the companies to supply all of the information it did in 2007 about lines - i.e., the previous FCC chart above - and we would know exactly how many lines were in service, and whether there was actual competition for special access.
And if the FCC required the original financial accounting - that had been collected since 1939, instead of canceling requirements circa 2007, we wouldn't have been overcharged (as badly). And if NY State had bothered to actually review the annual reports it required, and audited the books when it raised rates, -- i.e., a rate case, it might have noticed the billions in cross-subsidies.
Obviously, it's time for multiple state and federal investigations to get at the bottom of these financial machinations and data manipulations.