

It's time once again to begin seriously taking a look at the electoral math for the upcoming election. I know, I know, everyone else is court watching this week, but instead I decided to spend some time poll watching, for those of you who may be getting tired of endless Supreme Court speculation and analysis.
This column series will examine the race between Mitt Romney and President Barack Obama in the only way that is useful for actually predicting its outcome: a state-by-state look at how each candidate is doing. National polling is almost completely useless in election prognostication, because our Constitution simply does not care what the national vote totals turn out to be (see: 2000 election). We actually elect presidents using the Electoral College, which makes such predictions a lot more complicated, because it necessitates examining each state's numbers individually. But "complicated" is our middle name here, so let's dig in and see what the state of the race (pun intended) truly is, at this point in time.
We're going to begin by taking a look backwards, in some ways. This column series ran throughout the 2008 election, which makes this fairly easy (because we saved the charts from back then). Let's start with a comparison of Barack Obama's status as it stands now with what it was back in 2008. Future columns may refer back to the 2008 charts, but to begin 2012 with a side-by-side comparison would be helpful (older charts are from my final 2008 Electoral Math column).
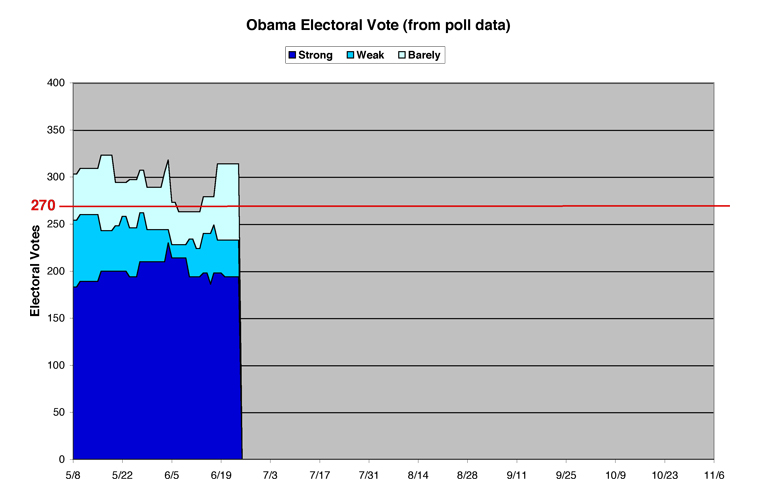
Final 2008 Obama Electoral Math Chart
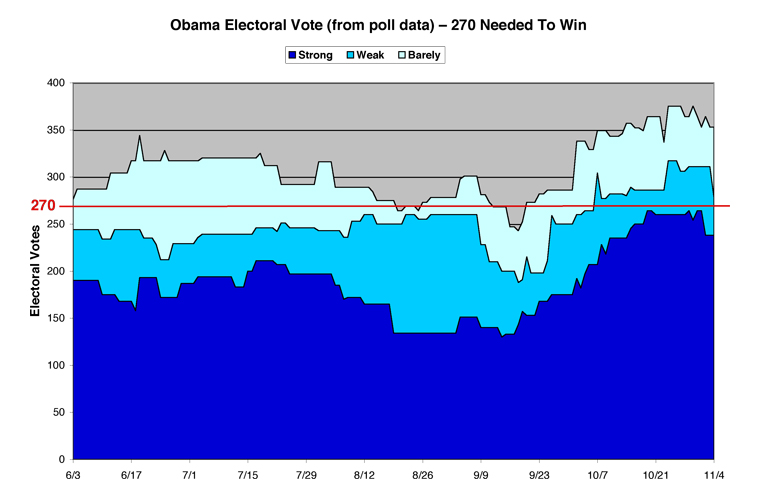
2012 Obama Electoral Math Chart
A technical note before we begin: We started our charts this year about a month earlier than we did in 2008 (May 8 vs. June 3), so take that into account when comparing the two. Also, click on any of these charts to see a larger version, with all the details visible.
These charts summarize the states where Barack Obama is leading the polls, broken down by how big a lead he has. The dark blue at the bottom is "Strong" support: a lead of 10 percentage points or more. The lighter blue in the middle is "Weak" support: from 5 to 10 percentage points ahead. And the very light blue at the top consists of states where Obama is "Barely" ahead: by less than 5 percentage points. The red line at 270 represents the total electoral votes (henceforth: "EV") needed to win the presidency.
Barack Obama is doing roughly the same as he was in 2008. His Strong support hovers just under 200 EV, occasionally climbing above it briefly. When you add in his Weak support, the total hits just below 250. Last time around at this point, Obama was doing somewhat better in the Barely category, leaving his overall total comfortably above 300. This time around, his overall total has already slipped below the crucial 270 mark once but has recently recovered. In 2008 this wouldn't happen to Obama until August, a cautionary note that this year's election is likely to be closer than the last time around.
Obama's EV overall total started at 290, rose to a high of 323, then slipped down to a low of 263 before recovering to today's 314. In 2008, on this date, Obama had a one-day spike up to 328, which fell back again to 317 the next day -- which is pretty close indeed to this year's standings.
Comparing Mitt Romney to John McCain is somewhat of an apples/oranges thing to do, but still worth a look.
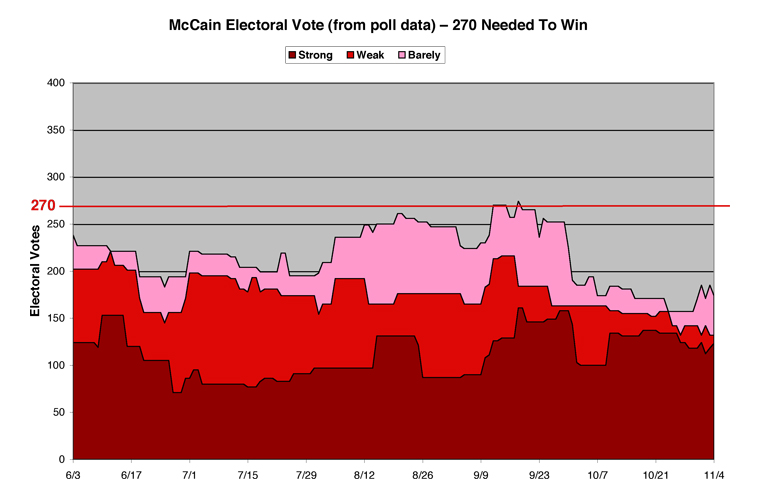
Final 2008 McCain Electoral Vote Chart
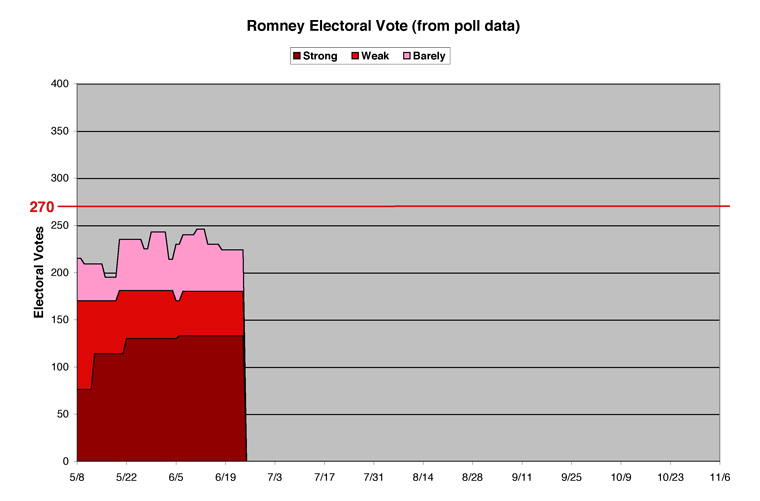
2012 Romney Electoral Vote Chart
I should mention that I'm getting my data from the same site I used last time around, Electoral-Vote.com. If you'd like to see a map with state-by-state breakdowns of these totals, you can start with today's map and work your way backwards through their archive to see which states have changed in the past few weeks. Once we get through the charts, I'll provide my own estimation of which categories each state truly belongs in, as well.
Romney is doing slightly better than John McCain, and his numbers seem more stable (which could be a result of not a whole lot of state-by-state polling being conducted this early in the season). Romney's Strong number stands now at 133 EV, essentially unchanged for the past month. By comparison, John McCain's Strong rating had fluctuated more at this point in the 2008 cycle, climbing above 150 EV briefly, but he stood at 105 at this point four years ago, soon to dip to a dismal 71, the lowest point he hit during his entire campaign.
Romney's Weak numbers have also stayed remarkably stable, especially when compared to McCain. When you add in Romney's Barely numbers, the total has stayed in the range between 200 and 250 EV so far, except for one brief dip down to 195. This is better than McCain was doing at this point; he experienced a one-day drop to 183 EV exactly four years ago, before pulling back to a total of 194.
The most critical line in both of these charts is the "Strong plus Weak" number. These represent states that are (for the moment) safely in one candidate's pocket or the other. Mitt Romney's numbers here are, again, remarkably stable when compared with McCain's. So far Romney's Strong plus Weak total has only fluctuated between 170 and 181 EV and today stands at 180. McCain was much more volatile, rising to a high of 221 and hitting a low exactly four years ago (a one-day blip of only 145 EV).
However, Barack Obama's Strong plus Weak has fluctuated between 224 and 260 EV and stands today at 233. This shows the clear lead Obama (so far) enjoys, a lead (today) of 53 electoral votes. To put it another way, of the "Barely" states on both sides, Obama has to gain only 37 electoral votes to win the election, whereas Romney needs 90 to win. That is a pretty hefty advantage, but then again, it is very early in the cycle, so don't read too much into these numbers yet.
With the charts out of the way, let's take our own personal state-by-state look at things.
My Picks
Because we've spent so much time on the charts (and looking backwards), this will be an abbreviated section today. Consider it a jumping-off point, with much more in-depth analysis later on. In our next column, we'll also have some charts and data from other sources included as well.
Full data on my picks (with complete lists of where I'm placing each state in each category) can be found at the bottom of this article, for easy reference.
My picks are much more subjective than just looking at a snapshot of where the polls currently are. I look at the state's performance over time in such polling and take into account my own personal feelings about each state's electorate, so this part of the column is a lot squishier in nature, just to warn everyone. This is actually the second one of these columns, I should also mention, as I ran a ridiculously early "gut feeling" look at the states over a month ago.
I use slightly different categories here, to differentiate my picks from the straight polling data. In the polling charts above, states are broken down into "Strong/Weak/Barely" solely on the lead percentage. Because my picks are a little more nebulous, I break them down into "Likely" states for each candidate (further divided into "Safe" and "Probable" subcategories), and "Tossup" states (broken down into those that "Lean" one way or another, and then "Too Close To Call"). Any questions? OK, then here we go....
Likely States -- Obama
Safe Obama (16 states, 194 EV)
These are states that Barack Obama is all but certain to win, and my list (see data section below) is pretty close to how the states have been performing in the state polling. Some might quibble that there are a few weak states on this list (such as Maine, Minnesota, New Jersey, or New Mexico), but at this juncture I'm pretty certain the whole list will wind up in Obama's column in November.
Probable Obama (4 states, 47 EV)
The four states, listed from weakest to strongest for Obama (in my opinion): Michigan, New Hampshire, Pennsylvania, Oregon. That last one may be the first state to move up into "Safe" territory for Obama, but at the moment it is being dragged down by a poll from back in May that had Obama only up by four points. Pennsylvania will likely go for Obama, although New Hampshire is always tough to call. Michigan has had some weak polling (including one poll that put Romney on top), but I believe the success of the Detroit bailout is going to carry the day for Obama in Mitt's home state (or one of them, at any rate).
Likely States -- Romney
Safe Romney (19 states, 156 EV)
Many of these, as with Obama's Likely states, haven't even been polled yet, because everyone knows which way they're going to vote. See the data section at the end for the full list of poll-less states. The only possible weak spots for Romney here are South Carolina, South Dakota, and Tennessee, but I'm betting all three will fall Romney's way on election night. One caveat: Nebraska splits its electoral vote, and Obama won one out of their five votes last time around, a feat that could conceivably happen this time around, as well.
Probable Romney (3 states, 24 EV)
Weakest to strongest, for Romney: Indiana, Missouri, Montana. Again, that last one will likely migrate to "Likely" soon, but we had to start Montana off as only "Probable." John McCain won Missouri by the thinnest of margins (3,900 votes out of 2.9 million cast), but Romney will likely do better this time around. Indiana was one of the surprising states that Obama won last time (Virginia and North Carolina were the others), and polling so far seems to put the state into Romney's column. If Obama racked up big wins in Michigan and Ohio, it's possible he could put Indiana into play again, but it's not looking likely at this point.
Tossup States
Lean Obama (3 states, 25 EV)
Which brings us to the most interesting categories: the true "tossup" or "battleground" states in this election cycle. Out of the nine states I've put here to begin with, three are leaning toward Obama: Colorado, Nevada, and Wisconsin. I think Obama has a clear edge in all three states, but this could change very quickly.
Lean Romney (2 states, 26 EV)
Romney has two states that seem to be leaning his way. North Carolina would be a pickup state for him (given that Obama won it last time around), and Romney has a small but persistent edge in polling here so far. The other state is more worrisome for Romney, given that Arizona was won by McCain last time around (as his home state). Recent polling in Arizona puts Obama within striking distance, but Romney continues to show a lead here, for now.
Too Close to Call (4 states, 66 EV)
Finally, the juiciest category of them all: those states that are truly anybody's guess, this far out. We'll have much more to say about these states in the coming weeks. All four of these states have already flipped the lead, or at least evenly tied in the polling. Obama looks stronger in Iowa and Virginia, but neither state is certain for him. Romney is running neck-and-neck with Obama in Florida and Ohio, and he may need both of these states in order to even have any possible path to garnering the 270 votes necessary to win. But, as the category title suggests, any of these states could go either way.
Barack Obama, heading into the summer, is showing a clear but not quite "commanding" lead over Mitt Romney in the electoral math. This is entirely normal; incumbents almost always enjoy such an advantage over their challengers this early on. Whether Obama can hold on to, and build upon, this lead remains to be seen.
For the moment, without counting leaning or tossup states, Obama comfortably has 241 EV on his side, to Romney's 180 -- a lead of over 60 EV. To cross the finish line, Obama needs only 29 more electoral votes from all nine battleground states (winning Florida alone would do it for him, to put it another way), whereas Romney needs to win a whopping 90 EV from the battleground states to claim the White House in November.
* * * * *
[Electoral Vote Data:]
(State electoral votes are in parenthesis following each state's name. Washington D.C. is counted as a state)
Barack Obama Likely Easy Wins -- 20 States -- 241 Electoral Votes:
Safe States -- 16 States -- 194 Electoral Votes
California (55), Connecticut (7), Delaware (3), Hawaii (4), Illinois (20), Maine (4), Maryland (10), Massachusetts (11), Minnesota (10), New Jersey (14), New Mexico (5), New York (29), Rhode Island (4), Vermont (3), Washington D.C. (3), Washington (12)
Probable States -- 4 States -- 47 Electoral Votes
Michigan (16), New Hampshire (4), Oregon (7), Pennsylvania (20)
Mitt Romney Likely Easy Wins -- 22 States -- 180 Electoral Votes:
Safe States -- 19 States -- 156 Electoral Votes
Alabama (9), Alaska (3), Arkansas (6), Georgia (16), Idaho (4), Kansas (6), Kentucky (8), Louisiana (8), Mississippi (6), Nebraska (5), North Dakota (3), Oklahoma (7), South Carolina (9), South Dakota (3), Tennessee (11), Texas (38), Utah (6), West Virginia (5), Wyoming (3)
Probable States -- 3 States -- 24 Electoral Votes
Indiana (11), Missouri (10), Montana (3)
Tossup States -- 9 States -- 117 Electoral Votes:
Tossup States Leaning Obama -- 3 States -- 25 Electoral Votes
Colorado (9), Nevada (6), Wisconsin (10)
Tossup States Leaning Romney -- 2 States -- 26 Electoral Votes
Arizona (11), North Carolina (15)
Too Close To Call -- 4 States -- 66 Electoral Votes
Florida (29), Iowa (6), Ohio (18), Virginia (13)
No polling data yet: (states which have not been polled so far)
Alabama, Alaska, Arkansas, Hawaii, Idaho, Kansas, Kentucky, Louisiana, Mississippi, Utah, Washington D.C., Wyoming
Chris Weigant blogs at:
Follow Chris on Twitter: @ChrisWeigant
Become a fan of Chris on The Huffington Post