

Hillary Clinton's lead in the race for Electoral College votes is shrinking. In fact, it has been shrinking for a solid month now. Two weeks ago (the last time I wrote one of these columns), this hadn't really benefited Donald Trump much. Now, however, Trump seems to be surging in the polls while Hillary slides even further.
Now, I wouldn't say it's quite time to panic for Democrats -- but that time may be just around the corner, unless Clinton can turn things around fairly quickly. The first presidential debate will happen one week from today, so such a turnaround is indeed possible in the near future.
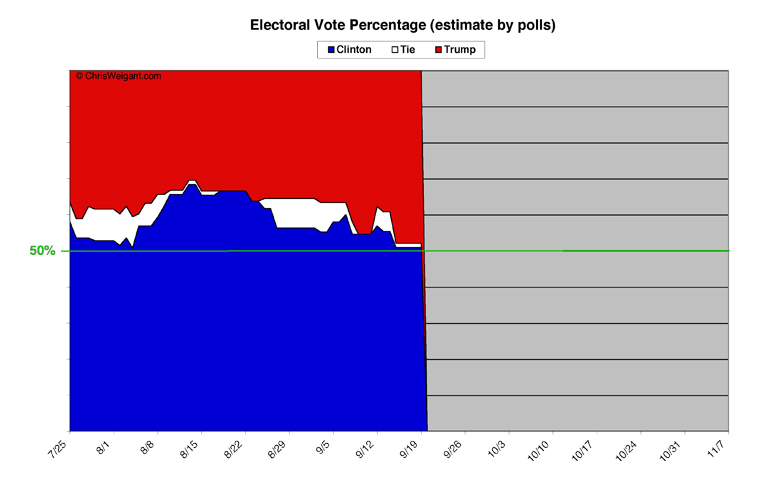
Let's take a look at the overall picture. Two weeks ago, Clinton had lost two big states (Florida and Ohio) into the "Tied" category (white, on the graph below). This time around, Trump picked them up and a few others as well, putting him at his strongest point in the race so far. Hillary still holds an edge, but it is now razor-thin.
All of these charts, in one way or another, graph Electoral Votes (EV) over time. The overview chart shows who would be ahead if the election were held today and all the polling is correct. Clinton starts from the bottom of the graph and goes up, and Trump starts from the top of the graph and goes down. If blue crosses the 50 percent line, Clinton will win, and if red dips below the 50 percent line, then Trump will win.
[Click on any of theses images to see larger-scale versions.]
You can see how close things have gotten. One state is currently tied (Nevada), and Clinton only has four EV more than necessary to win. Trump, however, has improved to 258 EV, meaning he's only 12 EV away from the magic 270 EV mark.
The shift from two weeks ago is dramatic. Back then, Hillary had 312 EV, to Trump's 197 EV. She has now dropped to 274 EV, while he rose to 258 EV. The trend is even more dramatic if you go back four weeks. One month ago, Hillary Clinton had 358 EV -- a full 84 EV more than she's got now. Four weeks ago, Trump was at 180 EV, which was 78 EV lower than he's at now. That's a pretty substantial turnaround.
Before we go any further, however, there is one important caveat. The polling site I use for all of my data (Electoral-Vote.com) is now including 50-state internet polls in its data. These polls are rather unreliable, but they do at least provide some sort of data for states that normally don't get polled even once during the entire election season. Now, for states that are true battleground states, this polling might move the bar for a short period, but will soon be overshadowed by other (more reliable) polls, so any problems self-correct over time. But for states that rarely (if ever) get polled, this can lead to basing conclusions on rather shaky data. One of these internet polls happened the day after I wrote my previous Electoral Math column, and the results were rather slanted towards Trump in a few states where it's hard to believe their data. New Mexico is perhaps the most obvious of these, where the internet poll showed Trump up 10 points (48 percent to Clinton's 38 percent). But without a better poll to confirm or rebut this data, I find it more than a little unbelievable.
But even with this caveat, Trump is unquestionably doing better. More than half of the states (27) showed movement in the past two weeks, although five of these eventually returned to where they started (Arkansas, Indiana, Iowa, Nebraska, and Utah). Of the others, Donald Trump got stronger in six of the states he's leading in (Georgia, Missouri, Montana, North Dakota, South Carolina, and Texas) and weaker in two (Alabama and Alaska). Hillary Clinton's numbers were almost exactly the opposite. In states she's holding, Clinton got stronger in only two (Connecticut and Virginia) and weaker in seven states (Maine, Michigan, Minnesota, New Hampshire, New Jersey, Rhode Island, and Wisconsin).
The bigger news, however, were the states that fully changed direction. Nevada went from Clinton's column to being tied, and Florida went from being tied to Trump's column. Three other states flipped all the way from Clinton to Trump. One of these, Ohio, may be flipping back and forth for some time to come, but the other two (Colorado and New Mexico) may flip comfortably back to Clinton when the next reliable poll is taken.
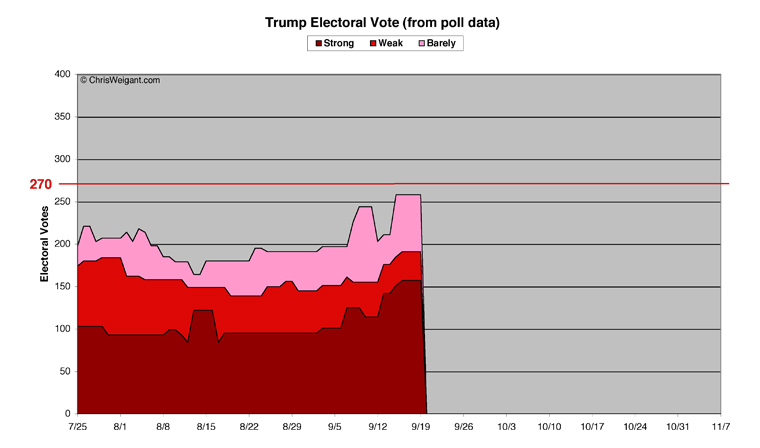
As you can plainly see, almost all the movement in the past two weeks has been towards Trump and away from Clinton. This is why many Democrats are already panicking, which I think is a little premature (more on this in a moment). First, let's take a closer look at each candidate's numbers, broken down into three categories: Strong, Weak, and Barely. First, we have Donald Trump's new chart.
[Definition of terms: "Strong" means 10 percent or better in the polls,
"Weak" means five percent or better, and "Barely" is under five percent.]
Donald Trump had the best two weeks he has so far managed. His Strong category went up from 101 EV two weeks ago to 157 EV now. Some historical context is necessary to understand how strong Trump is currently doing. In the entire 2008 election cycle, John McCain's best Strong showing was 161 EV. Mitt Romney's 2012 high point in this category was 158 EV -- only one more than Trump currently has. Trump lost two states from Strong in the past two weeks (Alabama and Alaska), but gained six (Missouri, Montana, New Mexico, North Dakota, South Carolina, and Texas). That's a pretty impressive showing (although, as I stated, I have reason to be suspicious of that New Mexico poll result).
Trump's Weak category actually decreased during this period, down from 50 EV to only 34 EV. This wasn't exactly bad news for him, though, as three states moved up to Strong (one of them being Texas), while two smaller states fell back from Strong to Weak (Alabama and Alaska). Georgia was the good news for Trump here, moving up from Barely to Weak.
Trump saw similar gains in the Barely column, which went up from 46 EV to 67 EV. Three states got stronger for Trump (Georgia, Missouri, and South Carolina), but the big news for Trump was the addition of three states that were previously either tied or in Clinton's column (Colorado, Florida, and Ohio). Florida and Ohio have 47 EV between them, it bears mentioning.
Of course, the metric I watch closer than any other is "Strong Plus Weak," which shows the states a candidate can comfortably count on going their way on Election Day. Four weeks ago, Trump had hit his all-time low in this category, at only 139 EV. Two weeks ago, he hadn't improved much, up to only 151 EV. Now, however, Trump is at his all-time high in this category, at 191 EV. That's a big turnaround, most of which happened in the past two weeks. Again, to put this number in context, both Mitt Romney and John McCain had periods above 200 EV in this category multiple times during their campaigns. So Trump still has some distance to go to match either of them.
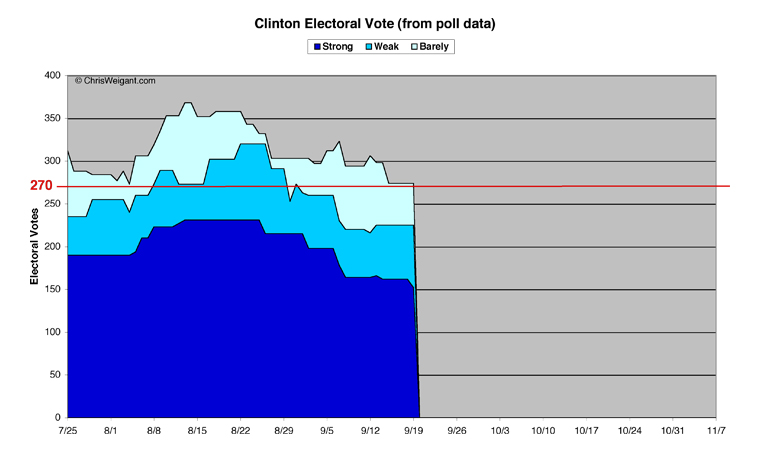
Enough of Trump, though, let's take a detailed look at Hillary Clinton's numbers.
That is a pretty sobering chart for Clinton supporters. Hillary Clinton got a whole lot of bad polling news in the past two weeks, which only added to the bad polling news she had gotten the previous two weeks. Her overall number has not yet slipped below the 270 EV needed to win -- something that happened to Barack Obama in both 2008 and 2012, for context. But she's only above it now by the skin of her teeth, meaning she has to turn things around fast or this is going to be a nail-biter of an election.
In the Strong category, Clinton was at 231 EV four weeks ago. Two weeks ago, she was at 198 EV. Today, she has slipped to 152 EV -- her lowest point to date. In the past two weeks, she added Connecticut to her Strong total, but lost five other states (Colorado, Maine, Minnesota, New Jersey, and Washington). Colorado went all the way from Strong Clinton to Barely Trump, in fact.
Clinton's Weak category wasn't quite as bad, with the movement in and out a little more mixed. Clinton gained four states in Weak that fell from Strong (Maine, Minnesota, New Jersey, and Washington), but Connecticut moved up to Strong. However, Michigan, New Hampshire and Wisconsin all fell from Weak down to Barely Clinton. And New Mexico (rather unbelievably, as mentioned) went all the way from Weak Clinton to Strong Trump. The good news for Clinton here was that Virginia moved up from Barely Clinton to Weak Clinton -- and Virginia might be one of the two or three states that decide this election. All of this added up to Clinton moving from 62 EV in Weak up to 73 EV.
Clinton's Barely numbers stayed roughly the same, even though there was some movement both in and out of the category. She started with 52 EV in Barely two weeks ago, and finished with 49 EV in the category. Michigan, New Hampshire, and Wisconsin all fell back to Barely from Weak, but Nevada moved from Barely Clinton to Tied, and Ohio went over to Trump's column. Virginia also left Barely Clinton, but it actually moved up to Weak Clinton, so this was the only good news here.
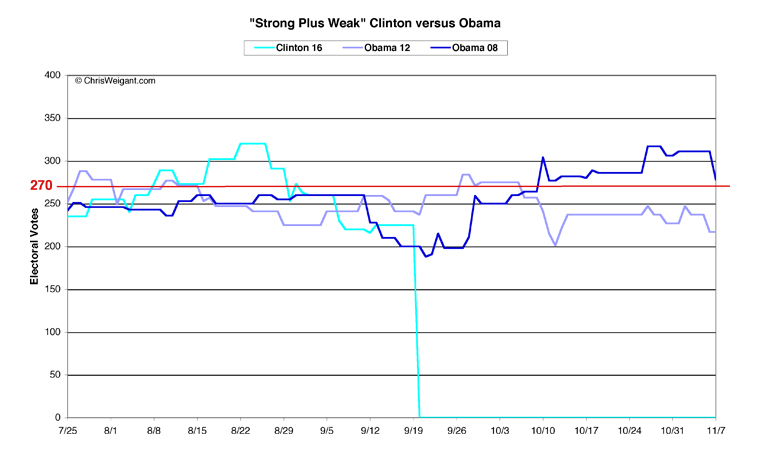
Clinton's Strong Plus Weak number fell dramatically, but very slightly improved afterwards, so perhaps she's hit bottom here. She started off the period at 260 EV in Strong Plus Weak, fell back to her all-time low of 216 EV, but then inched up to 225 EV, where she remains. This is where some historical context becomes necessary (so as not to panic too much). Here is my chart of the Strong Plus Weak metric for Hillary Clinton versus Barack Obama's two elections.
As you can see, Clinton's Strong Plus Weak line is between where Obama was in 2008 and where he was in 2012, at precisely the same point in the election cycle. In 2012, Obama was at 241 EV in Strong Plus Weak right now, and in 2008 he had fallen to 200 EV (and he would fall even further before he bounced back). In fact, on Election Day in 2012, Obama was only at 217 EV in this category -- down eight from where Clinton is right now. This is why I caution that Democrats shouldn't be panicking (yet), because even though Clinton is indeed down in the polls right now, she hasn't lost her lead and could still very easily win the election (as Obama did, both times). One solid debate performance may be all that Hillary Clinton needs to start recovering a much bigger lead, in fact.
My Picks
Since predicting which states will do what on Election Day is (to me, at least) more than just a data-driven exercise, I have to take into account my gut feelings for each particular state. This is where I can freely discount poll numbers I simply don't trust, to put it another way. To signify this, I use different categories here, dividing states into Safe, Probable, and Leans for each candidate as well as the Too Close To Call category for those where things could still go either way. Before we get to individual picks, here's my updated map (which I created at 270toWin, where you can make your own map and post a link to it, if you disagree with my picks). And, as always, full lists of my state picks are at the end of the column, with their EV totals.
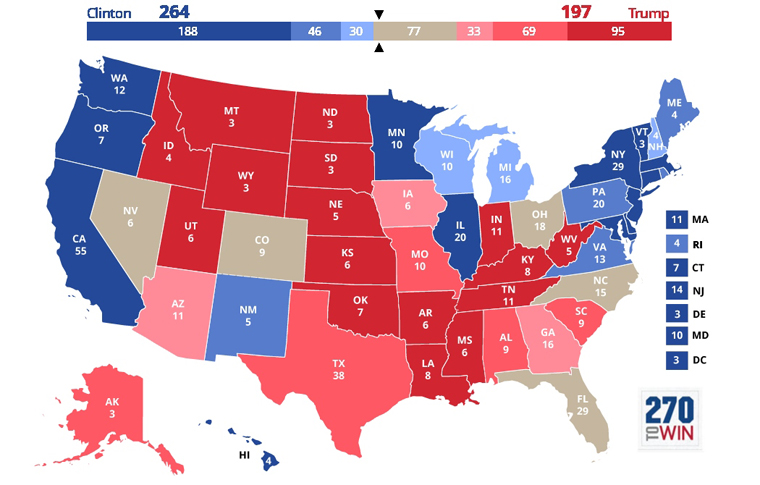
Likely States -- Clinton
Safe Clinton (14 states, 188 EV)
I only changed three states here this time around. I moved Maine and Rhode Island down to Probable Clinton, and Connecticut up from there. A few other states showed weaker polls in this category (Minnesota, New Jersey, Washington), but I think they're outlier polls so I'm keeping all three in Safe Clinton for now.
Probable Clinton (5 states, 46 EV)
This category had the most reshuffling this time around, with only two of the previous seven remaining in place. Pennsylvania stayed steady, which could in fact be the best news for Clinton this time around (Trump's path to victory almost requires him to win Pennsylvania). New Mexico is supposedly 10 points up for Trump right now, but I refuse to believe this poll because it is so far out from what any other poll has shown here. So perhaps I'll consider moving it if further polling justifies it, but for now I still think it remains as a Probable Clinton state. Connecticut moved up from this category to Safe, and Virginia moved up into Probable from Leans Clinton. Maine and Rhode Island moved down to Probable from Safe, but the bad news was the states moving down from this category to Leans Clinton (Michigan, New Hampshire, Wisconsin), or even down to Too Close To Call (Colorado). So the new full list of Probable Clinton states this week is: Maine, New Mexico, Pennsylvania, Rhode Island, Virginia.
Likely States -- Trump
Safe Trump (16 states, 95 EV)
Five states shifted within the Safe category for Trump. Two (Alabama and Alaska) moved down to Probable. Three (Montana, North Dakota, and Utah) moved up from Probable. Trump's EV total didn't change, however, as both of these groups added up to 12 EV each.
Probable Trump (5 states, 69 EV)
Other than the five states that shifted between Probable and Safe for Trump, two states moved up from Lean Trump to Probable -- Missouri and South Carolina. This leaves five states as Probable for Trump: Alabama, Alaska, Missouri, South Carolina, Texas.
Tossup States
Leans Clinton (3 states, 30 EV)
There was a lot of movement in all of the Tossup categories this time around. All three of the previous Leans Clinton states moved out of the category, two of which were bad news (Nevada and Ohio moved down to Too Close To Call), and one of which was good news (Virginia, which improved to Probable Clinton). Three other states moved in to take their place (Michigan, New Hampshire, and Wisconsin), all down from Probable Clinton.
Leans Trump (3 states, 33 EV)
Two of the four states previously in the Leans Trump category improved to Probable Trump (Missouri and South Carolina). Iowa moved up from Too Close To Call to Leans Trump, as almost all the recent polls have shown he has a very slight edge there. In addition to Iowa, Arizona and Georgia stayed Leans Trump this time around, leaving Trump with three states in this category.
Too Close To Call (5 states, 77 EV)
I try to keep this category as small as possible, but had to expand it this week. Iowa moved up to Leans Trump, but the other two states previously in Too Close To Call remained (Florida and North Carolina). My gut tells me Clinton's got an excellent chance in both Florida and North Carolina, but the poll numbers are so tight that I can't even bring myself to move them up to Leans Clinton yet. The bad news here for Clinton is that three states moved down to Too Close To Call from her categories this time around. Both Nevada and Ohio are too close to even put them in Leans Clinton, and the big surprise was Colorado moving all the way down from Probable Clinton to Too Close To Call. Colorado, unlike New Mexico, has had more than one poll showing Trump with a very tiny lead, so for the time being it has to be considered a tossup.
Final Tally
My final tally -- even with my possibly-biased gut feelings figured in -- is actually worse for Clinton than the straight poll numbers would indicate. Safe Clinton states add up to almost exactly what they were two weeks ago, but she lost a lot of ground in the Probable Clinton category. This means a total of only 234 EV that Clinton can still count on in November. This is down from 260 EV last time around, and is a lot further away from the 270 EV needed to win.
Donald Trump, unlike last time around, actually added states that Clinton was letting slide away from her. Most of these are still only in the Leans Trump category for now, but Trump added one state to his Safe column and one to his Probable column. This gave him 21 states that he doesn't currently have to worry about, for a total of 164 EV. This is up from last time around, but only by 19 EV -- not as high a jump as you might think.
I think one more quick "Don't panic!" note is necessary for worried Democrats, here. Even though Trump is now at a high and Clinton is at a low point, Clinton still has 70 EV more than Trump in these categories. Hillary's lead has indeed shrunk considerably (two weeks ago, she was leading by 115 EV here), but she is still in the lead, and by a fairly large margin. Clinton needs 36 EV more to win, but Trump needs 106 EV. Hopefully, that puts things into a better perspective.
There are now 11 battleground states, for a total of 140 EV. Both Trump and Clinton have three apiece that lean in their direction, and five are too close to accurately predict. But for the first time in this race, Clinton will need at least one of the Too Close To Call states, because her leaners added to her likely states only total 264 EV. If Clinton wins either Nevada or Colorado, she'll be our next president -- even if she loses Florida, North Carolina, and Ohio to Trump.
Adding Trump's leaners to his likely states only totals 197 EV, by comparison. Trump has to win all his leaners and all the Too Close To Call states to claim victory. Which is a tall order, although for the first time a Trump path to 270 EV is now a real possibility.
What this all means is that Hillary Clinton is still leading the presidential race for Electoral College votes, by a pretty wide margin. However, the trend lines don't look too good for her, so she's got to turn things around in several key states before her supporters stop considering panicking. She still has the lead, but that lead has been shrinking for the past month. If it shrinks any further, the entire race might be a lot closer than anyone would have thought (myself included) even one month ago.
[Electoral Vote Data:]
(State electoral votes are in parenthesis following each state's name. Washington D.C. is counted as a state, for a total of 51.)
Hillary Clinton Likely Easy Wins -- 19 States -- 234 Electoral Votes:
Safe States -- 14 States -- 188 Electoral Votes
California (55), Connecticut (7), Delaware (3), Hawaii (4), Illinois (20), Maryland (10), Massachusetts (11), Minnesota (10), New Jersey (14), New York (29), Oregon (7), Vermont (3), Washington (12), Washington D.C. (3)
Probable States -- 5 States -- 46 Electoral Votes
Maine (4), New Mexico (5), Pennsylvania (20), Rhode Island (4), Virginia (13)
Donald Trump Likely Easy Wins -- 21 States -- 164 Electoral Votes:
Safe States -- 16 States -- 95 Electoral Votes
Arkansas (6), Idaho (4), Indiana (11), Kansas (6), Kentucky (8), Louisiana (8), Mississippi (6), Montana (3), Nebraska (5), North Dakota (3), Oklahoma (7), South Dakota (3), Tennessee (11), Utah (6), West Virginia (5), Wyoming (3)
Probable States -- 5 States -- 69 Electoral Votes
Alabama (9), Alaska (3), Missouri (10), South Carolina (9), Texas (38)
Tossup States -- 11 States -- 140 Electoral Votes:
Tossup States Leaning Clinton -- 3 States -- 30 Electoral Votes
Michigan (16), New Hampshire (4), Wisconsin (10)
Tossup States Leaning Trump -- 3 States -- 33 Electoral Votes
Arizona (11), Georgia (16), Iowa (6)
Too Close To Call -- 5 States -- 77 Electoral Votes
Colorado (9), Florida (29), Nevada (6), North Carolina (15), Ohio (18)
Polling data weaknesses:
Unlike in 2008 and 2012, polling data does now exist for all 51 states (adding in Washington D.C.). The following list is of states where the polling data is rather suspect, since only one or two polls have been conducted, all on the internet.
Internet-only polling, with dates last polled -- 20 States
Alabama (9/8), Alaska (9/1), Delaware (9/8), Hawaii (9/1), Illinois (9/8), Kentucky (9/8), Louisiana (9/8), Maryland (9/8), Mississippi (9/8), Montana (9/8), Nebraska (9/8), New Mexico (9/8), New York (9/8), North Dakota (9/1), South Dakota (9/1), Tennessee (9/8), Washington (9/8), Washington D.C. (5/31), West Virginia (9/8), Wyoming (9/1)
Chris Weigant blogs at:
Follow Chris on Twitter: @ChrisWeigant