
The Lame-Duck Honeymoon
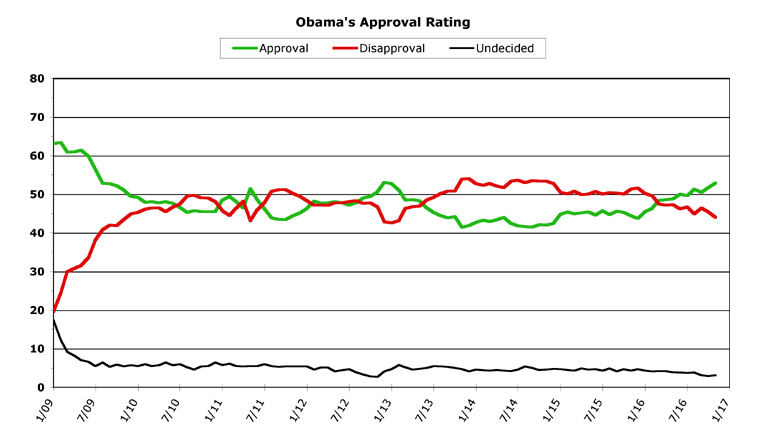
President Obama is on track to end his second term in office with higher job approval than he began it, back in January of 2013. Call it the third (or lame-duck) honeymoon, if you will. Obama saw record job approval in November, measured both monthly and daily, and tied his daily low for job disapproval (previously set February 24, 2013). After a very strong October, Obama charted an even stronger November in public opinion polls. Let's take a look at the new chart for this month to see all of this.
[Click on graph to see larger-scale version.]
November, 2016
After gaining 1.2 points in October, Obama's average monthly job approval rose at exactly the same rate in November, which put him at 52.9 percent approval for the month -- beating the 52.7 percent record high he set at the very beginning of his second term. Obama's disapproval rating improved even more -- after falling a single point in October, Obama's job disapproval monthly average fell 1.4 points in November, putting him at 44.0 percent disapproval. The trend was clear all month long, with no reversal in his daily average's improvement.
As this column series winds down (only two more to go after this one!), monthly analysis becomes rather pointless. All presidents usually get a bounce upwards during the lame-duck period at the end of their term, and Obama is no exception. Partly this is due to people exhausted over the years-long presidential contest, partly it is due to people looking forward not backward, and partly it is due to people giving Obama the benefit of the doubt on his way out the door. Even George W. Bush got a tiny bump upwards in the polls in his final months in office (although that's relative to his record-low ratings for almost his entire second term -- Bush rose from a dismal 25.3 percent approval before the 2008 election to reach only 29.3 percent approval in his final month in office).
So, really, the only political analysis necessary for Obama's final months is "people are already missing him, before he's even gone." That's all that really needs to be said, at this point.
Overall Trends
The overall trend, obviously, is up. Barack Obama is going to have his most-improved year ever, at this point that much is just about guaranteed. At the end of last December, Obama was at only 43.7 percent average monthly job approval, and 51.6 percent disapproval -- a total of 7.9 percent "underwater." In the past eleven months, his job approval has improved a whopping 9.2 points, while his disapproval fell 7.6 points. He's now 8.9 percent above water and setting second-term records. Almost every one of the months in 2016 were positive for Obama, with only two real setbacks -- both of which he easily overcame the following month.
Obama not only charted his best second-term monthly average job approval in November, he also had the best daily average of his second term as well. For three days at the end of the month, Obama was at 54.0 percent approval -- noticeably up from the 52.7 percent high-water mark he set the previous month. Before that, Obama's best showing was right after his inauguration, when he was at 52.5 percent in January of 2013. Obama also tied his lowest second-term job disapproval daily average last month, matching the 42.3 percent mark he charted in February, 2013.
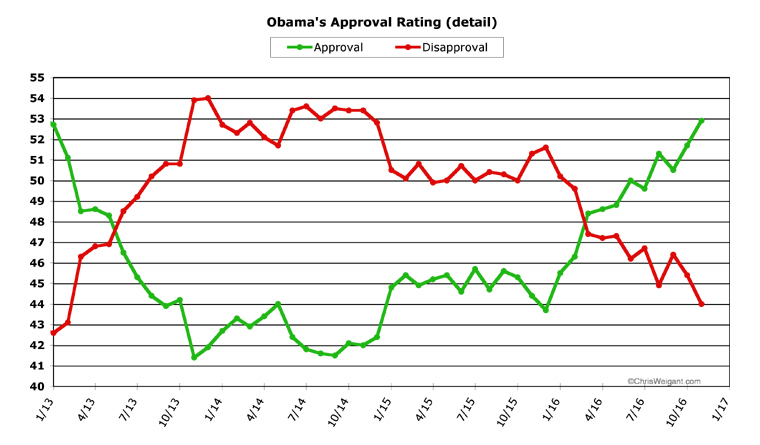
Below is an expanded chart of Obama's entire second term. He's visibly doing better than he even did during his second honeymoon, right after being sworn in for the second time.
[Click on graph to see larger-scale version.]
As you can clearly see, Obama has been having a fantastic 2016. With only two months left of data to chart, Obama is almost certain to end up in a very positive place with the public at the end. His job approval may not continue to rise quite as steeply in the final two months, but then again it might even accelerate.
Of the four previous presidents who served two full terms since modern polling became available, Obama seems likely to join the three who ended their terms in positive territory (Bill Clinton, Ronald Reagan, and Dwight D. Eisenhower), and thus avoiding being lumped in with the only two-term president to end up deep in negative numbers (George W. Bush).
The other presidents from the polling era have a more mixed record, but none of them served a full two terms. Jimmy Carter served a single term, but ended up with negative numbers. George H. W. Bush also served only four years, but got such a big post-election bounce (after Clinton won) that he wound up in positive territory.
The rest of the presidents served fractional terms. Richard Nixon served about a term and a half, but then resigned in disgrace with job approval ratings slightly worse than George W. Bush's, at the end. Gerald Ford served a half a term, and Lyndon Johnson served about a term and a quarter, but both men ended up in an unusual place (there were a lot more "undecided" responses, back then) -- below a majority of 50 percent, but with job approval still above water compared to job disapproval. And finally, John F. Kennedy was struck down three-quarters of the way through his first term, and ended with positive ratings.
Viewed historically, Barack Obama's job approval with the public is nowhere near the best ever (Clinton holds this record, followed by Reagan and Eisenhower), but a lot better than many previous presidents can claim. As we approach the end, more and more people are feeling a lot better about the past eight years, when put in historical context.
[Obama Poll Watch Data:]
Sources And Methodology
ObamaPollWatch.com is an admittedly amateur effort, but we do try to stay professional when it comes to revealing our sources and methodology. All our source data comes from RealClearPolitics.com; specifically from their daily presidential approval ratings "poll of polls" graphic page. We take their daily numbers, log them, and then average each month's data into a single number -- which is then shown on our monthly charts here (a "poll of polls of polls," if you will...). You can read a much-more detailed explanation of our source data and methodology on our "About Obama Poll Watch" page, if you're interested.
Questions or comments? Use the Email Chris page to drop me a private note.
Obama's Second Term Statistical Records
Monthly
Highest Monthly Approval -- 11/16 -- 52.9%
Lowest Monthly Approval -- 11/13 -- 41.4%
Highest Monthly Disapproval -- 12/13 -- 54.0%
Lowest Monthly Disapproval -- 1/13 -- 42.6%
Daily
Highest Daily Approval -- 11/(25,26,29)/16 -- 54.0%
Lowest Daily Approval -- 12/2/13 -- 39.8%
Highest Daily Disapproval -- 12/2/13 -- 55.9%
Lowest Daily Disapproval -- 2/24/13, 11/(27,28)/16 -- 42.3%
Obama's Second Term Raw Monthly Data
[All-time high in bold, all-time low underlined.]
Month -- (Approval / Disapproval / Undecided)
10/16 -- 52.9 / 44.0 / 3.1
10/16 -- 51.7 / 45.4 / 2.9
09/16 -- 50.5 / 46.4 / 3.1
08/16 -- 51.3 / 44.9 / 3.8
07/16 -- 49.6 / 46.7 / 3.7
06/16 -- 50.0 / 46.2 / 3.8
05/16 -- 48.8 / 47.3 / 3.9
04/16 -- 48.6 / 47.2 / 4.2
03/16 -- 48.4 / 47.4 / 4.2
02/16 -- 46.3 / 49.6 / 4.1
01/16 -- 45.5 / 50.2 / 4.3
12/15 -- 43.7 / 51.6 / 4.7
11/15 -- 44.4 / 51.3 / 4.3
10/15 -- 45.3 / 50.0 / 4.7
09/15 -- 45.6 / 50.3 / 4.1
08/15 -- 44.7 / 50.4 / 4.9
07/15 -- 45.7 / 50.0 / 4.3
06/15 -- 44.6 / 50.7 / 4.7
05/15 -- 45.4 / 50.0 / 4.6
04/15 -- 45.2 / 49.9 / 4.9
03/15 -- 44.9 / 50.8 / 4.3
02/15 -- 45.4 / 50.1 / 4.5
01/15 -- 44.8 / 50.5 / 4.7
12/14 -- 42.4 / 52.8 / 4.8
11/14 -- 42.0 / 53.4 / 4.6
10/14 -- 42.1 / 53.4 / 4.5
09/14 -- 41.5 / 53.5 / 5.0
08/14 -- 41.6 / 53.0 / 5.4
07/14 -- 41.8 / 53.6 / 4.6
06/14 -- 42.4 / 53.4 / 4.2
05/14 -- 44.0 / 51.7 / 4.3
04/14 -- 43.4 / 52.1 / 4.5
03/14 -- 42.9 / 52.8 / 4.3
02/14 -- 43.3 / 52.3 / 4.4
01/14 -- 42.7 / 52.7 / 4.6
12/13 -- 41.9 / 54.0 / 4.1
11/13 -- 41.4 / 53.9 / 4.7
10/13 -- 44.2 / 50.8 / 5.0
09/13 -- 43.9 / 50.8 / 5.3
08/13 -- 44.4 / 50.2 / 5.4
07/13 -- 45.3 / 49.2 / 5.5
06/13 -- 46.5 / 48.5 / 5.0
05/13 -- 48.3 / 46.9 / 4.8
04/13 -- 48.6 / 46.8 / 4.6
03/13 -- 48.5 / 46.3 / 5.2
02/13 -- 51.1 / 43.1 / 5.9
01/13 -- 52.7 / 42.6 / 4.7
Second Term Column Archives
[Oct 16], [Sep 16], [Aug 16], [Jul 16], [Jun 16], [May 16], [Apr 16], [Mar 16], [Feb 16], [Jan 16], [Dec 15], [Nov 15], [Oct 15], [Sep 15], [Aug 15], [Jul 15], [Jun 15], [May 15], [Apr 15], [Mar 15], [Feb 15], [Jan 15], [Dec 14], [Nov 14], [Oct 14], [Sep 14], [Aug 14], [Jul 14], [Jun 14], [May 14], [Apr 14], [Mar 14], [Feb 14], [Jan 14], Dec 13], [Nov 13], [Oct 13], Sep 13], [Aug 13], [Jul 13], [Jun 13], [May 13], [Apr 13], [Mar 13], [Feb 13], [Jan 13]
First Term Data
To save space, the only data and statistics listed above are from Obama's second term. If you'd like to see the data and stats from Obama's first term, including a list of links to the full archives of the Obama Poll Watch column for the first term, we've set up an Obama Poll Watch First Term Data page, for those still interested.
Follow Chris on Twitter: @ChrisWeigant
Full archives of OPW columns: ObamaPollWatch.com