There are many sources of uncertainty in election polling other than sampling error. One source of error that looms large in this year's closest races is undecided voters -- people who say they are going to vote, but don't know (or won't say) which candidate they prefer. In YouGov's final round of surveys in the closest Senate and governor's races, the percentage of undecideds ranged from 11% to 13%, but in the closely contested governor's and Senate contests in Kansas, the percentage of undecideds was 21% and 22%, respectively. Given how close all of these races are, a relatively small advantage for one party or the other among undecideds would be enough to flip the outcome.
Different organizations use different procedures to identify undecided voters. For most polls, the process requires a series of questions which are worded somewhat differently and may have different response categories. In YouGov's polls we first screened for whether someone was registered and then identified likely voters (those who said they "definitely will vote" or "probably will vote" in Tuesday's election). Likely voters were asked "which candidate are you voting for?" (or, in the case of early voters, "which candidate did you vote for?"). "Not sure" is explicitly offered as an option, and respondents that choose this option were asked, as a follow-up question, "Which candidate are you more likely to vote for?" Our definition of "undecided voters" includes only voters who not only weren't sure, but answered the follow-up question by saying they were "equally likely" to vote for either candidate.
There are some important differences between a poll with live interviewers and a self-administered web survey. Offering an explicit "not sure" option in a vote choice question generates substantially more initially undecided voters than in a phone poll where it is a volunteered response. With a live interviewer, respondents are usually read a list of candidates they could vote for, but the interviewer does not tell respondents that they have the option to say they are undecided. However, some respondents do tell the interviewer that they are "undecided" or "not sure" or "don't know" and this response is duly noted. An explicit option attracts more responses, so an online interview normally starts with a larger pool of undecideds. Most telephone and web surveys ask those who are initially undecided which candidate they "lean toward" or "are more likely to vote for."
Of course, on election day, the ballot does not include an "undecided" or "not sure" response option. Most polls solve this problem by reporting a margin for one candidate over the other. If all undecideds don't vote or split in the same proportions as the rest of those interviewed, the final margin will be slightly larger than the margin reported, but this is usually not an important source of error. On the other hand, the undecideds may turnout and vote differently from the rest of the sample. In this case, the error in the poll's margin can be large and important.
Frankly, I don't know how likely undecided respondents are to vote and, if they vote, which way they will split. There's quite a bit of speculation about how late deciding voters split, but it's based on remarkably little hard data. After the election, we can (and will!) go back to our respondents and ask them what they did.
But we do have some data about undecided voters: their demographics, past voting behavior, and party identification. And the patterns we found suggest that the number and distinctiveness of undecided respondents in critical Senate and governor's races is sufficient to swing some of these races.
For the most part, undecideds are moderate and independent. Between 58% and 73% identify as independents and don't even lean toward one of the major parties. A majority of undecideds in Colorado, Florida, Georgia, Iowa, Kansas, North Carolina, and Wisconsin called themselves "moderate." The remainder are more likely to be conservative than liberal, especially in Georgia, Kansas, and North Carolina.

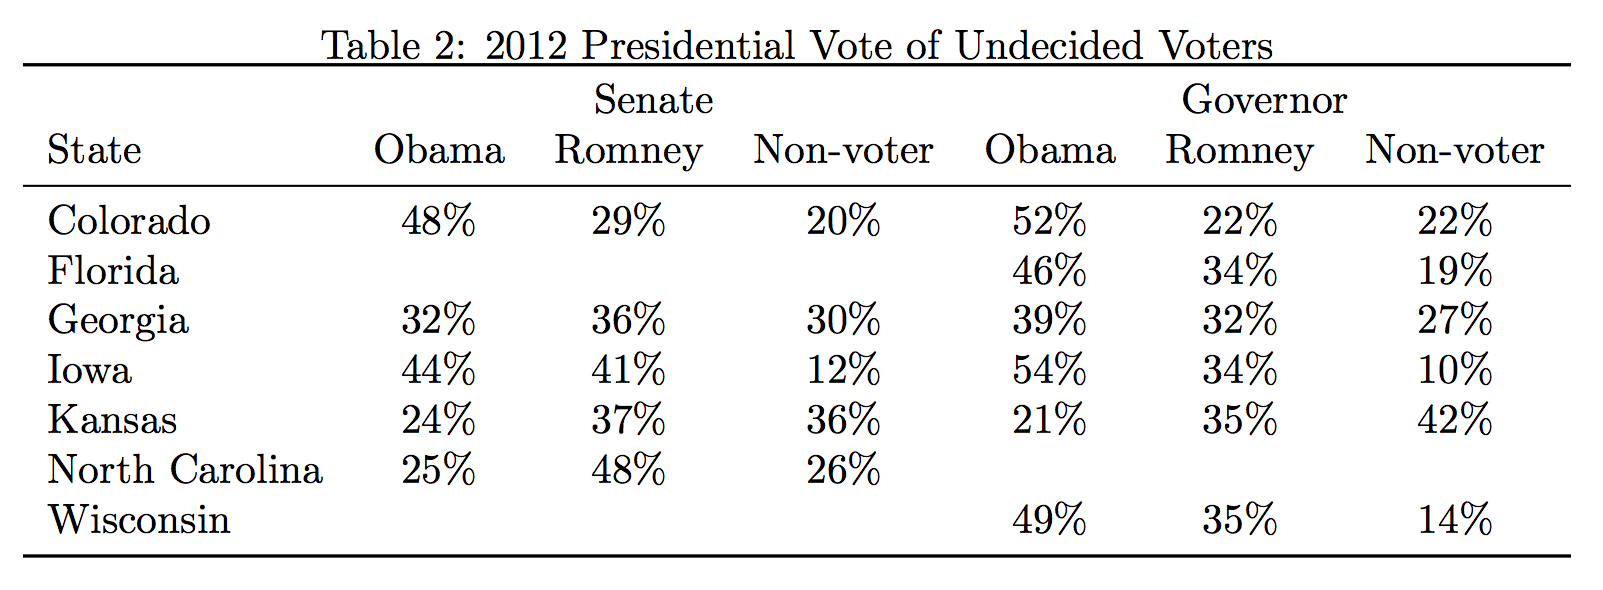
Some hints about the leanings of undecideds can be gleaned from how they voted in 2012. Many undecideds (between 12% and 42% depending on the race) say that they did not vote in the 2012 presidential election, which makes one suspicious of their likelihood of voting in the 2014 midterm election. However, of those who say that they voted in 2012, there is considerable variation in how they split between Obama and Romney. In Colorado and Iowa, undecideds in the 2014 Senate race favored Obama over Romney in 2012 by 48-29 and 44-41, respectively. In the other Senate races, undecideds favored Romney over Obama by a little (Georgia) and a lot (in Kansas and North Carolina).
Last, and perhaps most significantly, undecideds are overwhelmingly female (typically in the range of 60-40 or 70-30). Women are much more likely to tell us that they are undecided than men. Among decided men and women, there was a gender gap in every one of these races, so, if undecided women end up voting similarly to decided women, this would be good news for Democratic candidates. Of course, there is currently no gender gap in expressed vote intention of undecideds (since all of these respondents declined our entreaties to express such an intention) and predicting that one might develop seems rather speculative
Details of these polls may be found here.