The Pew Research Center just released a report worth a close look, called "The Lost Decade of the Middle Class." (For the record, I wrote this a year ago... I await royalties.)
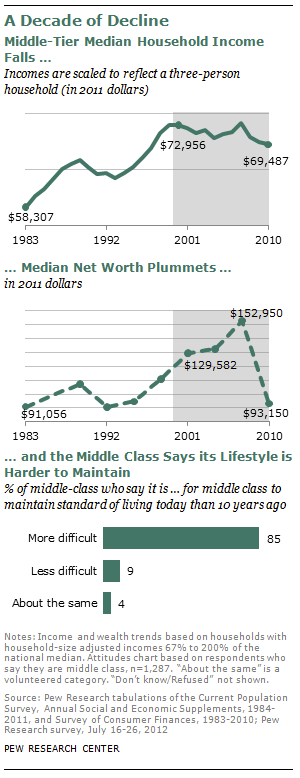
The title comes from the observation that real median income or the more comprehensive measure of net worth were lower at the end of the last decade than at the start (see figures below).
That's historically unusual, if not unprecedented. For years, starting in the 1980s, I wrote that median wages and incomes were diverging from productivity growth and were growing considerably more slowly than they had in the past. But they were at least growing in real terms -- i.e., they were lagging behind productivity but at least beating inflation. Now, they're lagging both.
Before digging into what's behind these changes, some definitions and a few other factoids of note from the report:
-- There is no accepted definition of middle-class families so everyone in this business has to make one up. Pew uses an admittedly arbitrary but reasonable measure: households with between two-thirds and two times the median income, which amounts to about $40-120K in 2011 dollars. Yes, you can definitely find families with higher incomes than that in some part of the country -- e.g., the urban northeast -- who could make the case that they're middle class too, but there's no perfect measure here.
-- As shown in the second chart below, real median net worth -- assets minus debts -- cliff-dove 2007-10, down a massive $60K, a 40 percent loss. Part of that dive is a "correction" from the unsustainable heights of the housing bubble -- for middle-class homeowners, housing, not cap gains or Cayman Island accounts, is at the heart of their wealth portfolio. But the fact that middle-class net worth is back to 1980s levels is important and unsettling.
-- The middle class may have been doing less well over time, but measured as noted above, they were always the largest share of the population and held the largest share of income. They still comprise the largest share of households, but just barely, at 51 percent, and their share of total income, trending down for decades, is now slightly below that of the top tier group.
What's behind all of this?
That's not a simple question and it's a lot of what we're about here at OTE... see here and here, e.g.
But one thing I thought about re the "lost decade" theme is the picture of job growth by decade you see here (pretty much decadal -- I tried to go business cycle peak-to-peak). Employment growth just sucked in the 2000s, not to put too fine a point on it. As I alluded to above, working middle-class families can't depend on their wealth portfolios to make ends meet and get ahead. For them, it's about the paycheck.
In this sense, a slack job market is the worst enemy of the middle class. All the political hurly-burly about budget deficits, tax changes, the 10-year budget window -- don't get me wrong -- that stuff's hugely important and I'll continue to beat the drum on it. But we can get all of that right and if we don't have a strong, tight, lasting (not bubble-and-bust) job market, I don't expect these middle class trends to improve much.
More to come on ideas to get there... and yes, I know few are listening now. But given the stakes, that's not going to stop me.