
Survey Monkey's newly released Electoral College Map currently shows Democratic nominee Hillary Clinton leading in enough states to win 307 electoral votes and defeat Donald Trump in the race for president (it takes 270 electoral votes to win).
The interactive map is based on 41,569 interviews conducted over the past eight days as part of SurveyMonkey's ongoing Election Tracking survey. Results will be updated regularly over the final two weeks of the campaign (scroll down on the map for a description of its functions).
Clinton continues to lead Trump in the national popular vote measured by our ongoing tracking survey that exceeds President Barack Obama's four percentage point margin over Republican challenger Mitt Romney in 2012. As reported by our partners at NBC News, our most recent week's data (October 17-23) show Clinton leading among likely voters by 5 percentage points (46 to 41 percent) on a 4-way choice featuring third party candidates, and by 6 points (50 to 44 percent) on a two-way choice between just Clinton and Trump.
While Clinton's lead currently exceeds Obama's 2012 margin of victory at the national level, the look of the electoral map is very different. Clinton leads narrowly in Florida and Pennsylvania, two key battlegrounds won by Obama, but she currently trails in Ohio and Iowa, two battleground states that Obama won twice. The margins in other midwestern states, like Michigan and Wisconsin, are currently closer than the results from 2012.
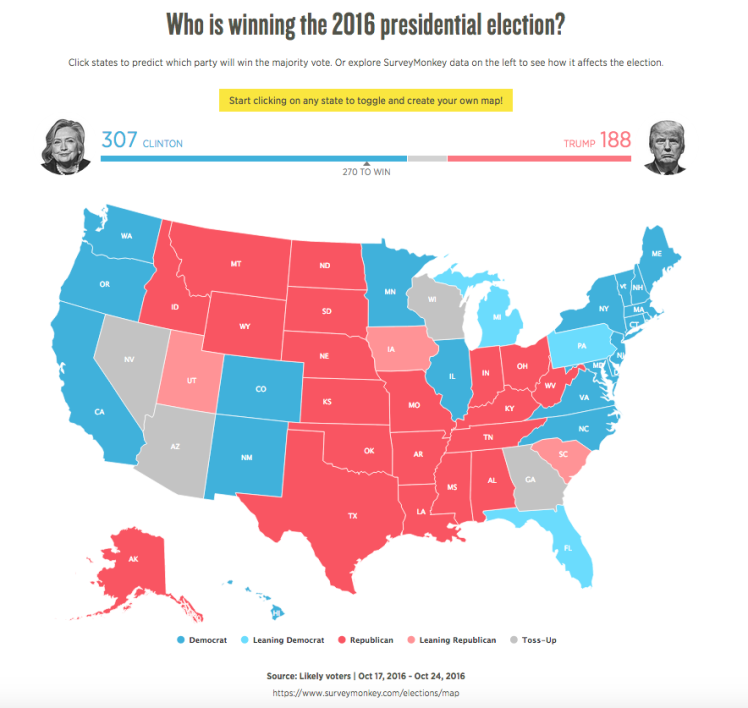
On the other hand, Clinton is leading in North Carolina, a state that Obama lost narrowly in 2012. Perhaps most remarkably, Trump's edge as of this writing is just a percentage point or two - a margin we classify as a toss-up - in Georgia and Arizona, states that Mitt Romney and John McCain won by wide margins. Even a state like South Carolina, which Romney won by over ten percentage points, is remarkably close in our tracking.
How can this be?
The pattern in the state results reflects what has been a consistent story throughout the 2016 campaign: a shift in voter preferences by level of education. Republican presidential candidates have won among college educated white voters for decades. Exit polls have shown Republican nominees winning white college graduates by margins of 4 points or better since 1996, with Mitt Romney winning this subgroup in 2012 by a 14 percentage point margin. This year, however, Clinton is poised to soundly defeat Trump among white registered voters with a college degree. She currently leads Trump in our national tracking by a 16 point margin (51 to 35 percent) among these voters.
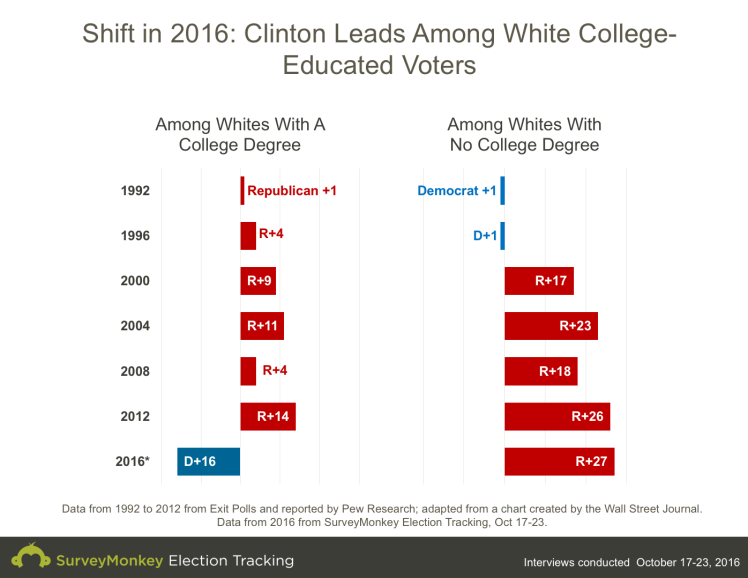
In contrast, Trump leads Clinton by an even bigger 27-point margin - 56 to 29 percent - among white registered voters without a college degree. However, that lead is roughly the same as the 26-point lead Mitt Romney enjoyed among non-college whites in 2012, according to exit polls.
A simple conclusion emerges from these details: Clinton is running far stronger among college-educated white voters than Democrats have done in recent elections, while Trump is doing only modestly better among non-college whites.
That combination helps explain why Clinton is struggling in midwestern states like Ohio and Iowa and seeing narrower margins than 2012 in states like Wisconsin and Michigan. These are states with relatively higher levels of non-college white voters.
Meanwhile, she is running far stronger than Obama did in 2012 battlegrounds like Colorado, Virginia and North Carolina, and even in previously reliable red states like Georgia, and Arizona - states where college-educated white voters are more predominant relative to non-college whites.
In previously red states, these trends are compounded by Obama's poor previous showings. As The New York Times' Nate Cohn recently explained, "there's a lot of room for Mr. Trump to fall among well-educated voters [in many red states], and little room to gain among white working-class voters."
Finally, a tip for how to take potential survey error into account while watching the results on our map update over the next two weeks. Each state result is based on a survey, which is subject to error, some random and some attributable to any imperfections in our ability to match our sample to the people who will cast ballots on Election Day (more details on our methodology are available here).
The random part is easier to quantify. For example, from week to week we often see apparently random shifts of 2-3 percentage points, sometimes more, on the margins separating Clinton and Trump. That's a simple explanation of why we classify any state a "toss-up" where a candidate leads by fewer than three percentage points. But don't be surprised if individual state estimates move around a bit over the next two weeks.
Again, given the current national standings, the important story is not about the precise margin in any one state, but about the larger pattern: Hillary Clinton is heading into the home stretch of the election with a lead in more than enough states to win the Electoral College. Stay tuned between now and Election Day for a lot more explanation and analysis of the results from our Electoral Map.
This SurveyMonkey Election Tracking survey for October 17th, 2016 through October 23rd, 2016 was conducted online among a national sample of 35,001 registered voters. Respondents for this survey were selected from the nearly 3 million people who take surveys on the SurveyMonkey platform each day.
This article is cross-posted to the SurveyMonkey Election Tracking Blog