At a time when many of us are anticipating what the election outcome will be, here we offer a summary document of where the electoral mood has been over the recent election cycle. We show the trends in electoral party preference that underlie the changes in the polls since the start of 2009. The idea is to tease out the partisan trend from available polls involving the national generic ballot plus state polls for senator and governor. We do this using regression analysis to predict poll margins (Democratic minus Republican) from three sets of dummy variables: the specific election (e.g., Colorado Senator), the pollster and type (e.g, Pew, likely voter) and the end-date of the poll. The unit of analysis in the regression is a reported poll. We incorporate generic ballot polls going back to January 2009 and state polls from the start of 2010.
For each day when a survey was recorded, we compute the average "effect" of that day on the vote margin, after controlling for the effects of specific campaigns, polling houses, and sampling types. The smoothed trend of these date effects can be thought of as a moving average of baseline party support. We collect these average date effects in the graphs below.
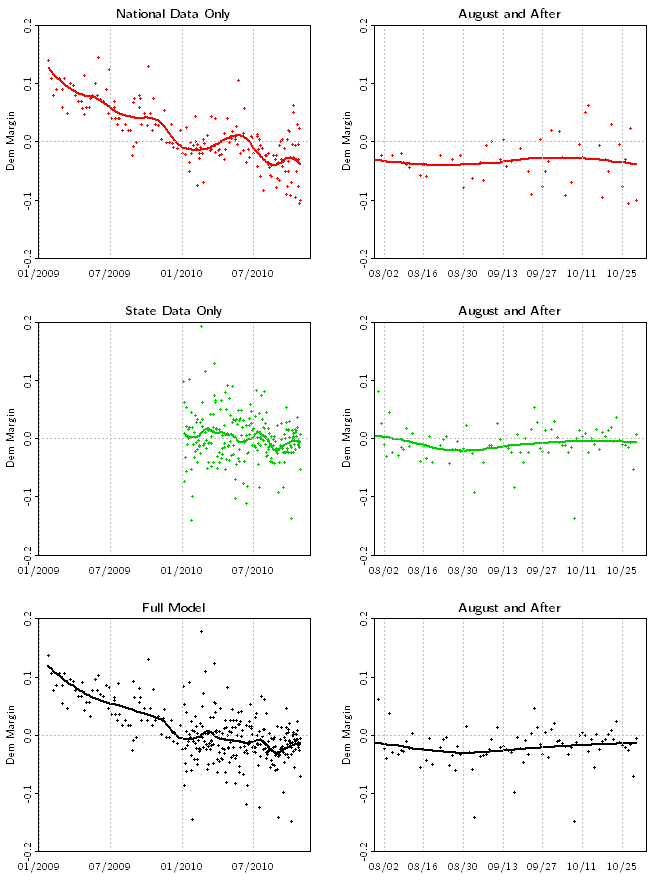
We norm the results to represent Gallup's registered voter polls, an arbitrary choice.The graphs present 6 separate plots. On the left-hand side we show results over the full2009-2010 span, and we focus in on the last 3 months of the election on the right. The top graphs (in red) show results using only national generic ballot polls. The middle graphs (in green) show the results with state polls only, beginning with the start date of our state poll collection, January 1 2010. The bottom graphs (in black) show the results with combined national and state results.
The trend follows our general understanding of partisan support over the last 2 years. When President Obama took office in January 2009, Democratic held about a 12 point lead, which during recent cycles was typical. But 2009 saw a steady decline of Democratic support towards a 50/50 electorate. Over the course of 2010, the decline in Democratic fortunes weakened considerably, with the lowess curves suggesting only modest change from January through October. In the state data one can even see a slight Democratic uptick over the final weeks.
We make no forecast of the actual outcome, only the relative trend. We estimate what the Gallup registered-voter poll would show day by day up to the latest measurement. Based on both national and state polls, as of October 30, the estimate is a Democratic deficit of about 1.4 points (Dem. minus Rep. = 1.4), while the national trend alone predicts a bigger Democratic deficit of 3.9 points . However we make no claim that either estimate will be the actual popular vote. In effect, the final vote margin will be a horizontal line through the data of our graphs. It remains to be seen where this line falls.