

The 2016 presidential election has been the wildest rollercoaster ride I can remember, and it looks like the final week will be even wilder than anyone imagined. So welcome back to Electoral Math, where we try to make some sort of sense of the state-level polling, measured over time.
I have to begin with a rather large caveat -- virtually none of the polling data below reflects what happened last Friday. In most states, no polls have happened since then, and even in the ones where it has, the story of the F.B.I. letter to Congress on the emails on Anthony Weiner's computer is still sinking into the public consciousness. So anything could happen in the polling in the next week, and in many states there won't even be any fresh polling to measure any public opinion shift. A wild ride indeed, as we head into the homestretch of the 2016 election.
Even before James Comey's bombshell letter, both Hillary Clinton and Donald Trump saw some strengthening at the state level, but also a significant amount of weakening. Overall, this news was worse for Trump than for Clinton. Trump lost three states from his column last week, two to being perfectly tied, and one all the way over to Clinton's column. Clinton saw some weakening in her states, and also saw a state flip to Trump.
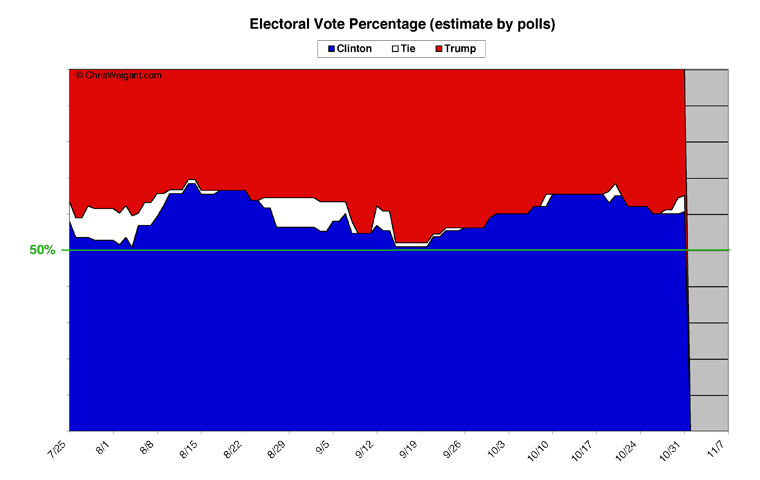
Let's start by taking a look at the overall total in Electoral Votes (EV). As always, this is how the Electoral College would vote, if the election were held today and if all the polling is correct. Hillary starts from the bottom, in blue; Trump starts from the top, in red. Whichever color crosses the 50 percent midpoint will win.
[Click on any of theses images to see larger-scale versions.]
Clinton lost ground early on, as Arizona flipped from barely being for Clinton to barely being for Trump. But while Trump gained ground at the start with Arizona's flip, he then steadily lost ground for the rest of the week. First Iowa, then Ohio changed from Trump to being tied (Iowa's flip was a surprise, while Ohio's been balanced on the edge for a while). The real stunner, though, came in this morning's poll results, when Alaska actually flipped over to being in Hillary Clinton's column. Now, this may just be one outlier poll (Alaska is notoriously hard to poll with any accuracy), but it's still pretty eyebrow-raising, this late in the race.
All told, Clinton now has 61 percent of the Electoral College votes, Trump has 35 percent, with 4 percent now tied. Both candidates fell back a bit from where they were last week, when Clinton was at 62 percent and Trump was at 38 percent (no states were tied, last week).
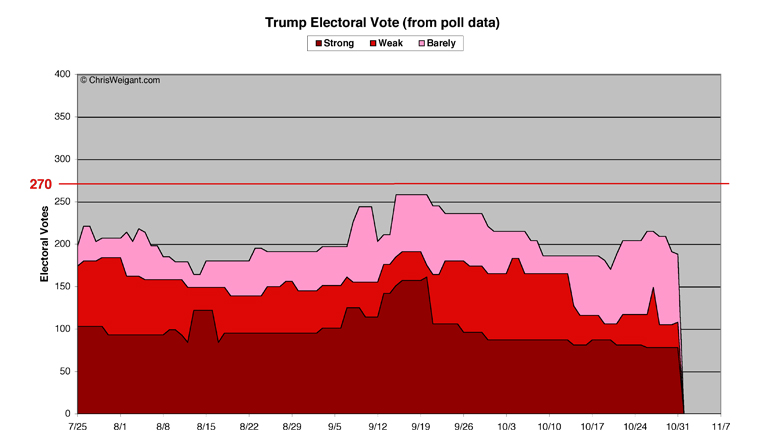
Which brings us to taking a closer look at the relative strength of support for each candidate within those totals. All polling data (as well as the category names and definitions) come from Electoral-Vote.com, as always. First, let's take a look at how Trump is doing.
[Definition of terms: "Strong" means 10 percent or better in the polls,
"Weak" means five percent or better, and "Barely" is under five percent.]
Donald Trump got good news in one state this week, but it was offset by bad news in three others. The beginning of the week was Trump's highpoint, as Arizona moved back to Barely Trump from Barely Clinton. Midweek, Trump saw Texas briefly wobble in his direction, which raised it from Barely Trump to Weak Trump (it's that spike in the middle of the graph, this week, since it has a whopping 38 EV), but then it wobbled right back again the following day, so it really didn't help Trump. Utah wobbled in the other direction, going from Weak Trump to Barely Trump and then back again.
Trump saw three states weaken this week, however. South Dakota fell from Strong Trump to Weak Trump, but that wasn't the worst news for Trump. Ohio went from Barely Trump down to being tied, and Iowa fell all the way from Weak Trump down to tied -- a total of 24 EV.
Trump started the week with 204 EV in his column, altogether. This went up to 215 EV with the addition of Arizona, but then started falling as he lost states. By week's end, Trump was only at 188 EV total, and his overall trendline was moving down.
Within the individual categories, Strong Trump started the week at 81 EV, then fell back to 78 EV (with the loss of South Dakota), where it ended the week. This is a new all-time low for Trump in the Strong category, in fact. The Weak Trump category started at 36 EV, which briefly rose to 71 EV (when Texas spent a day in the Weak category), but then fell right back to 27 EV. Today, Trump lost Alaska but got Utah back in Weak, to finish at 30 EV for the week. Trump's Barely category moved around quite a bit, starting at 87 EV, rising to 104 EV, and then falling back to only 80 EV at the end.
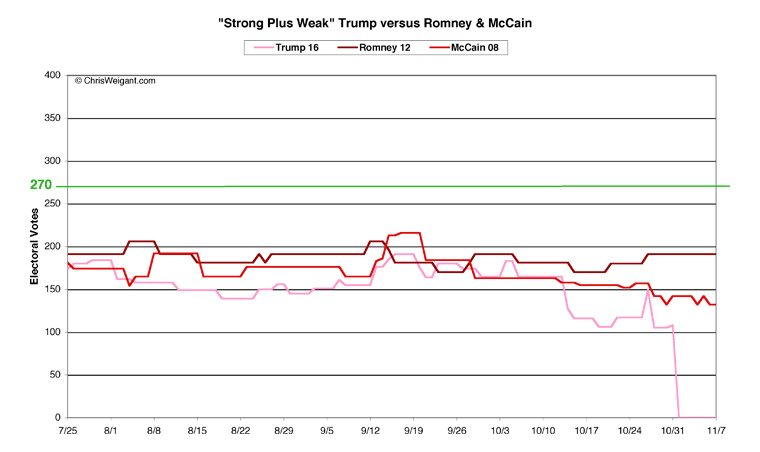
My favorite metric, however, is the "Strong Plus Weak" line, which I feel shows which states the candidates can really count on, come Election Day. Let's take a look at how Trump is doing here, stacked up against Mitt Romney and John McCain.
This is where Trump's weakness becomes rather easy to see. Trump began the week with 117 EV in Strong Plus Weak, rose briefly (with the addition of Texas) to 149 EV, but then fell back again to the lowest point he's seen yet, at only 105 EV. He did manage to get back to 108 EV today, but that's still astonishingly short of where Romney and McCain were at this point (before losing the race, mind you). McCain's lowest point of his entire race was 132 EV, and McCain currently had 142 EV in his corner. That is 34 EV more than Trump can now count on. Romney, at this point in his race, had 191 EV in Strong Plus Weak, where he would finish the race.
There will be plenty of time for lots of "what might have been" reflection for Republicans later, but it's pretty obvious even now that if a more conventional Republican candidate were running this race, those numbers wouldn't be quite so bad.
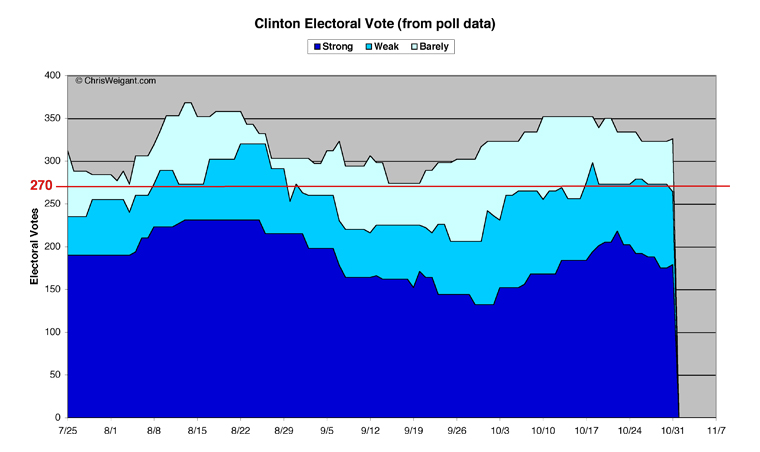
Which brings us to how Hillary Clinton's doing.
While Clinton's numbers are (quite obviously) much better than Trump's, she also saw her support weakening last week -- most of which (I remind you) happened before the F.B.I. letter news broke.
Hillary Clinton saw improvement in two states this week, but this was offset by weaker numbers in five states. In addition, Nevada tantalizingly went from Barely Clinton to Weak Clinton, but then wobbled back to Barely by week's end.
First, the good news. Clinton strengthened her support in Maine from Weak up to Strong at the end of the week. On the same day, there was that extraordinary poll which put Alaska into her Barely column, stealing it away from the Weak Trump column. You can take this poll with a grain of salt -- or not -- as you see fit. I find it a little too extraordinary to put much stock in it, myself.
The bad news for Clinton was mostly a weakening, across the board, but she did start the week off by losing Arizona back to Trump. Arizona's been flipping back and forth between the two candidates for the whole race, so it's anyone's guess how they'll wind up voting next Tuesday.
Of much more concern to the Clinton team was seeing three states drop from Strong Clinton down to only Weak Clinton. Minnesota, New Hampshire, and Virginia all made this move during the week, which you can see in the downward trajectory of the Strong graph line above. This continues a trend which began last week, in fact. Clinton's Strong number hit 218 EV nine days ago, started this week at 202 EV, then continued to fall to 175 EV. When Maine firmed up, this rose slightly to 179 EV, but the trendline should still be cause for concern to Team Clinton. In addition, Colorado also weakened, moving from Weak Clinton to only Barely Clinton.
All of this taken together meant Clinton's overall total fell from 334 EV down to 326 EV at the end of the week. Still a lot better position to be in than Trump, but turning those trendlines around would help Clinton enormously right now.
Clinton did better outside of the Strong category, last week. Her Weak numbers went from 71 EV up to 98 EV before finishing up at 85 EV. The Barely Clinton category fluctuated from 61 EV down to 44 EV, but then recovered to finish at 62 EV.
The next chart is the most frustrating for Clinton fans, as we look at Clinton's Strong Plus Weak performance, measured against Barack Obama's two races.
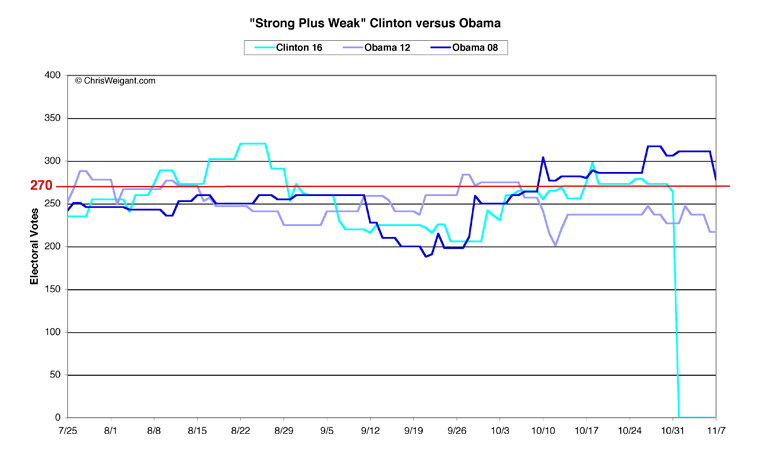
Clinton just can't seem to put the race away, in the same fashion Obama managed in 2008. At the start of the week, it looked like she was on her way, up to 279 EV (nine more than she needs to win) in Strong Plus Week -- only seven fewer than the 286 EV Obama managed at this point in 2008. But where Obama's line climbed from there, Clinton's has fallen. She spent most of the week at 273 EV, but then fell back to only 264 EV at the end, with the loss of Colorado. This is the first time in two weeks that Clinton's Strong Plus Week fell below the 270 EV necessary to win.
Still, she's beating Obama's 2012 standing, so there's no real cause for alarm. While Obama was at 306 EV a week out in 2008, he was only at 227 EV in his 2012 run -- far fewer than Hillary's got in her pocket now. This is why I like these charts, because they tend to put things into perspective.
My Picks
Moving on from just poll data, I have to add in my own gut feelings about some of these states before I make my own picks as to how the lay of the land truly appears to me, at this point. That Alaska poll, for instance, is rather unbelievable without any confirmation.
I should mention that while I hedged a few bets this week (with a much higher number of states in the Too Close To Call category), in next week's final installment of the 2016 Electoral Math column series, I will not have any "tossup" states, and will make my final predictions as to the outcome of the presidential race. So you've got that to look forward to.
Here's my map for this week, as always courtesy of the 270toWin site, where you can make your own maps if you disagree with any of my picks.
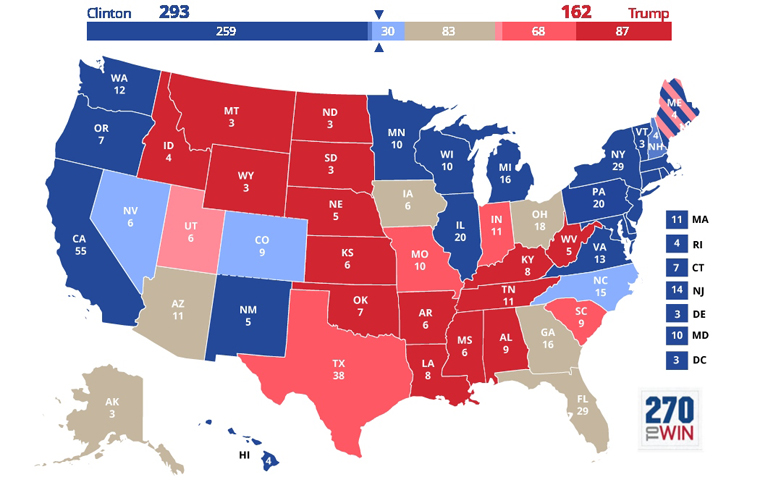
Likely States -- Clinton
Safe Clinton (21 states, 259 EV)
Two states moved out of the Safe Clinton category, and two states moved in to take their place. Due to closer polls, I moved New Hampshire down to Probable Clinton, and Colorado all the way down to Leans Clinton. A case could be made for either category for both of these states, but I just feel stronger about Clinton's chances in New Hampshire, I suppose. Polling is almost constant in both states, so perhaps we'll see further movement in the next few days.
Probable Clinton (1 state, 4 EV)
After moving Michigan and Pennsylvania down from Safe Clinton last week, I am moving both of them right back up again this week. Polling continues to be strong for Clinton in both states, so by this point I think they're both pretty safe bets for Clinton, even though Trump is making a play for both of them. This leaves only New Hampshire as Probable Clinton this week.
Likely States -- Trump
Safe Trump (15 states, 87 EV)
No change this week (for the second week in a row). All of Trump's strongest states remained the same this week.
Probable Trump (4 states, 68 EV)
Just like last week, though, there was considerable movement in the Probable Trump category. Three states (Indiana, Missouri, and South Carolina) stayed as Probable Trump this week. But two states moved out, and one very big one moved in. Iowa moved sharply away from Trump last week, to the point where it has to be considered Too Close To Call. This is rather odd, because Trump has been leading in the polling here for the past two months. Trump likely still has the edge here, but recent polling put the state tied, so for now it has to be considered a true tossup. The even odder news was a poll from Alaska which actually put Hillary Clinton four points up (47 to 43 percent) over Trump. Now, there just isn't much polling data out of Alaska, and the state is notoriously hard to accurately poll, so I'm skeptical that Clinton really has a chance of taking the state. If it was a state with more data, I'd put it as Leans Clinton, to put this another way. In the end, I think the state is at least leaning towards Trump, but since Clinton is leading in the most-recent poll, I have to put it as Too Close To Call this week. But the good news for Trump is that Texas seems to have firmed back up. Since Texas (with 38 EV) outweighs the loss of Iowa (6 EV) and Alaska (3 EV), Trump actually improved in this category this week.
Tossup States
Leans Clinton (3 states, 30 EV)
Clinton got bad news in this category this week, as Colorado moves down here all the way from Safe Clinton, and Florida falls back to Too Close To Call. Clinton still has a razor-thin edge in almost all the Florida polling, but the margin is so tiny that the state truly has to be considered a coin-flip at this point. The good news for Clinton here is that Nevada and North Carolina still remain in the Leans Clinton category.
Leans Trump (1 state plus 1 district, 7 EV)
This category almost emptied out this week, as Texas moved back up to Probable Trump. The remaining state here is Utah, which in normal times I would classify as at least Probable Trump. However, the wild card of Evan McMullin's campaign means that anything could happen on Election Day here -- McMullin might even win Utah's 6 EV, a feat that neither Ralph Nader nor H. Ross Perot ever managed to achieve. Trump has been number one in the polling, for the most part, but McMullin and Clinton are so close (and with the inherent instability of a true three-way race) that at the most the state has to be considered only Leans Trump at this point. As I said, a case could be made that it should be Probable Trump, but a case could also be made that it should be in Too Close To Call, as well. For now, it remains in Leans Trump, together with Maine's second congressional district (with its single Electoral College vote).
Too Close To Call (6 states, 83 EV)
Three states remained Too Close To Call this week, and three more joined them. Arizona is still teetering on the edge, although Trump now has the very slight lead in the past two polls. Georgia still could go either way, and Ohio seems to be perfectly tied right now. Iowa was previously Probable Trump, but now also seems to be perfectly tied for the moment. Alaska also moved down to Too Close To Call from Probable Trump, due to that one poll showing Clinton up. And Florida moves back to Too Close To Call, down from Leans Clinton. Once again, I have to point out how bizarre it is to have states like Georgia, Arizona, and Alaska considered tossups in a presidential race, but that's where we are, one week out.
Final Tally
Hillary Clinton swapped states back and forth within the Likely grouping (between Safe Clinton and Probable Clinton), but the bad news for her this week was losing Colorado down to only Leans Clinton. Clinton noticeably improved in the Safe category, up from 236 EV to 259 EV. While two states left the category (Colorado and New Hampshire), two much bigger states moved in to take their place (Michigan and Pennsylvania), leading to the overall improvement. However, this showed up in the drop in numbers for the Probable Clinton category, which shrank from 36 EV down to a paltry 4 EV. But the loss of Colorado from the Likely group meant the total she can reliably count on dropped from 272 EV down to 263 EV. This is seven less than she needs to win (rather than two more, as it was last week). This shouldn't really be cause for panic, but it will mean Clinton will have to pick up at least one (or maybe two) of the Tossup states.
Donald Trump is holding on to his core states quite well -- his Safe category hasn't budged for two weeks, and remains at 15 states and 87 EV. The good news for Trump was moving Texas back to his Probable category, which meant an improvement here from 39 EV last week up to 68 EV this week. Added together, this gives Trump 19 states in the Likely group, with a total of 155 EV -- up from 126 EV last week. That's a real improvement, late in the race. However, it doesn't appear to be enough. True, Trump is up to 155 EV in Likely, but Hillary Clinton beats him by over 100 EV in her Safe category alone, just to put it in perspective. Trump still needs 115 EV to win the race; Clinton only needs 7 EV.
The gap between the two candidates in their Likely categories decreased last week, down from 146 EV to only 108 EV. However, this hasn't really changed the dynamic of the race -- Clinton still has multiple paths to victory, Trump only has one and it consists of "sweep all the states that are even close."
The Tossup group this week rose in number to contain 10 states, but due to Texas firming up for Trump the actual total fell this week, from 140 EV last week to only 120 EV today. Still, that's quite a few battleground states -- and not exactly the battleground list the pundits have been predicting since the beginning. Of these 10 states, three are leaning towards Clinton, one towards Trump, and the other six are anyone's guess. Clinton has to pick up either Colorado or North Carolina, and she's already across the finish line. However, if she wins all her Likely states and only adds in Nevada, it would result in a 269-269 EV tie. It probably won't happen, but I thought I'd at least mention the possibility. Clinton could also win just by winning one of four states in the Too Close To Call category (Arizona, Florida, Georgia, or Ohio). If she only wins Alaska, she'll need a second state, and if she only wins Iowa it'll put us right back at that 269-269 tie.
Trump, on the other hand, has to run the table. Adding states which Lean Trump (Utah and that Maine district) to his Likely total only gives him 162 EV, still over 100 away from the goal. Even if he also won all the Too Close To Call states, he'd only be at 245 EV -- still 25 EV short.
I have to end with the same large caveat that I began with, however. Almost all of this polling does not reflect any shift in public opinion which may have happened after the bombshell F.B.I. letter was leaked last week. Things still could swing wildly at the last minute. So far, the polling which has happened since Friday has not shown this to be the case -- yet. But there is no guarantee what will happen later this week. As of right now, Hillary Clinton still has to be considered the prohibitive favorite to win this race. But last-minute shifts in opinion don't always get reflected in the polls, so we'll all have to wait and see what happens next Tuesday.
One final note: this is my penultimate Electoral Math column. So join us here next week for the final installment, as I'll provide my definitive picks for who will win each state -- with no tossups at all. Yes, the day before the election I'm going to attempt to predict who wins, everywhere. My record so far in calling states in presidential elections: 49 right out of 51 (2008), and 51 out of 51 (2012). So join me next week for the final picks!
[Electoral Vote Data:]
(State electoral votes are in parenthesis following each state's name. Washington D.C. is counted as a state, for a total of 51.)
Hillary Clinton Likely Easy Wins -- 22 States -- 263 Electoral Votes:
Safe States -- 21 States -- 259 Electoral Votes
California (55), Connecticut (7), Delaware (3), Hawaii (4), Illinois (20), Maine (3), Maryland (10), Massachusetts (11), Michigan (16), Minnesota (10), New Jersey (14), New Mexico (5), New York (29), Oregon (7), Pennsylvania (20), Rhode Island (4), Vermont (3), Virginia (13), Washington (12), Washington D.C. (3), Wisconsin (10)
Probable States -- 1 State -- 4 Electoral Votes
New Hampshire (4)
Donald Trump Likely Easy Wins -- 19 States -- 155 Electoral Votes:
Safe States -- 15 States -- 87 Electoral Votes
Alabama (9), Arkansas (6), Idaho (4), Kansas (6), Kentucky (8), Louisiana (8), Mississippi (6), Montana (3), Nebraska (5), North Dakota (3), Oklahoma (7), South Dakota (3), Tennessee (11), West Virginia (5), Wyoming (3)
Probable States -- 4 States -- 68 Electoral Votes
Indiana (11), Missouri (10), South Carolina (9), Texas (38)
Tossup States -- 10 States -- 120 Electoral Votes:
Tossup States Leaning Clinton -- 3 States -- 30 Electoral Votes
Colorado (9), Nevada (6), North Carolina (15)
Tossup States Leaning Trump -- 1 State (plus one district) -- 7 Electoral Votes
Maine (1), Utah (6)
Too Close To Call -- 6 States -- 83 Electoral Votes
Alaska (3), Arizona (11), Florida (29), Georgia (16), Iowa (6), Ohio (18)
Polling data weaknesses:
Unlike in 2008 and 2012, polling data does exist for all 51 states (adding in Washington D.C.). What follows are two lists of states: one where the polling data is rather suspect, since the only polls which have been conducted were all conducted only on the internet; and one where no data has been available during October. Both of these lists shrank last week, leaving only 12 states with data that is either suspect or rather outdated.
Internet-only polling (with dates last polled) -- 5 States
Hawaii (9/1), Kentucky (9/1), Mississippi (9/1), Washington D.C. (5/31), West Virginia (9/1)
No polls since September (with dates last polled) -- 7 States
Connecticut (9/5), Delaware (9/28), Maryland (9/30), Nebraska (9/27), North Dakota (9/17), South Carolina (9/26), Wyoming (9/11)
Chris Weigant blogs at:
Follow Chris on Twitter: @ChrisWeigant