
With the coming tsunami of 2012 election season polls, it's always good to play Monday morning (or Wednesday afternoon) quarterback.
My read of the data suggests there were many dynamics in the Iowa electorate not being captured by polls taken in the final week before caucus night. Mitt Romney, Rick Santorum and Ron Paul's final vote tallies all exceeded their final poll estimates, and final votes for Newt Gingrich, Rick Perry, Michele Bachmann, and John Huntsman all fell below their estimates.
Huffington Post's senior polling editor Mark Blumenthal analyzed the final 11 polls taken before caucus night, and accurately predicted a Romney win and Santorum surge. However, the specifics of the "win-surge" message have some implications for forthcoming polls.
First, let's take a look at the final poll estimates compared to the final caucus vote tallies. Blumenthal's numbers and some of my own calculations are included in the table below.
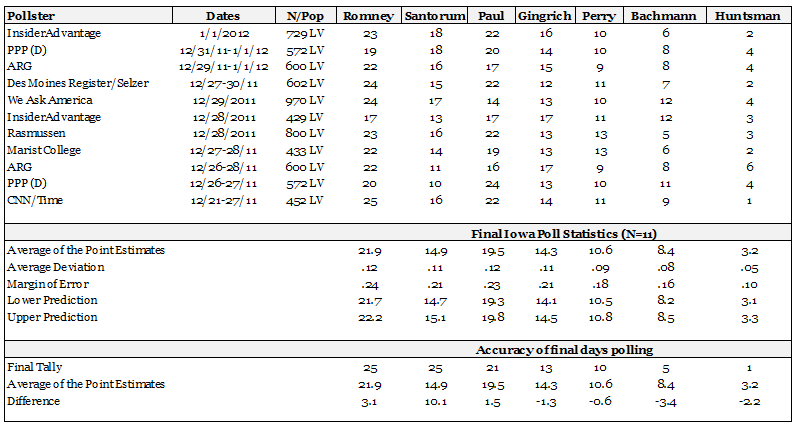
The upper portion of the table contains results from the earlier analysis of the final eleven polls of Iowa's likely GOP caucus voters posted the morning of Election Day. The middle portion of the table shows the averages, margin of error (MOE), and estimate intervals for the 11 polls. The lowest portion of the table compares the final vote tallies from the Iowa caucuses to the averages of the poll estimates.
When the final tallies are compared to the averages, the top three candidates Romney (+3.1 points), Santorum (+10.1), and Paul (+1.5) each exceed their average point estimates, Gingrich (-1.3) and Perry (-.6) are close but slightly lower than their averages, and Bachmann (-3.4) and Huntsman (-2.2) are well below their averages. This first look is telling, but it doesn't consider the variability in estimates from the 11 polls (e.g., Romney's poll numbers range from 17 to 25 percent). The more appropriate analysis would include the poll-to-poll error related to the 11 polls.
When the poll-to-poll MOE is included in the analysis, it becomes clearer how well the top three candidates performed relative to the other candidates. Romney, Santorum, and Paul all exceed their estimates even when the error is considered. For example, the 11 polls predict that Santorum's final tally would range from 14.7 percent to 15.1 percent.; he received 25 percent. The polls estimated Paul would receive between 19.3 percent and 19.8 percent of the vote; he received 21 percent. The winner, Romney, earned 25 percent of the vote, exceeding the expected interval of 21.7 percent and 22.2 percent.
Of course the narrative out of Iowa has been Romney's failure to win more votes. While he clearly beat the poll based expectations, everything is relative; Santorum beat his estimates more.
In contrast to the top three performers, the bottom four GOP candidates each fell below their estimates. Bachman fared the worst. The polls estimated she would receive between 8.2 percent and 8.5 percent of the vote, she received 5 percent. Gingrich received 13 percent of the vote, but the polls estimated he'd perform much better, garnering between 14.1 percent and 14.5 percent.
There are several takeaways from this quick and dirty analysis. First, beware the "horse race" -- those night to night stories on who's winning and who's losing. The polls correctly predicted the winner in Iowa, but that's about it. The point estimates were not that accurate and all of the candidates either exceeded or fell below expectations.
Second, lower than expected turnout suggests that the likely voter indicators used in the polling methodologies may not be as accurate as expected in the caucus setting. Predicting likely voters is tough, but perhaps it's time to include an "enthusiasm" indicator in the models.
Third, analysts might begin to partition the computerized polls from the live interviewer polls. I know, I know... more work that the media and public don't care about. However, while both types will contain weighted numbers, the population of respondents, length of questionnaires, types of and ordering of questions, and the social context are all typically different across data collection modes which simply adds to the errors in estimation. Combining them into a single picture may not help the industry down the road.
Fourth (and this is for the novices) always remember the MOE when examining a single poll. The MOE is that little plus or minus number that is usually shown but mostly ignored in discussions. Many news journalists and evening talk show hosts have incorrectly used the phrase "outside the margin of error" to describe differences in poll estimates.
For example, if Romney received 25 percent support compared to Gingrich's 18 percent support, and the margin of error is 5 percent, then a novice analyst would say the 7 percent point difference (25 percent - 18 percent) is outside of the 5 percent error. However, the margin of error applies to both numbers being compared, not just the difference between them. Romney's 25 percent and Gingrich's 18 percent are both "point estimates" that have error.
In reality, when the MOE is considered, Romney's estimate in the population is really between 20 percent and 30 percent, and Gingrich's estimate is really between 13 percent and 23 percent. When the intervals overlap, there is no statistical difference between the two estimates. When the estimate intervals are large -- 8 -10 percentage points or more -- the public should expect final tallies to differ from final polls.
Moving forward, the polls will continue to dominate the election discussion, but there's more to their value than the horse race. The polls may not be the best at predicting numbers, but they can be useful in explaining why things happen. For example, Bachmann was the worst under-performer and this may explain why she is no longer in the hunt for nomination.
Also, perhaps the under-performance of the bottom four explains the over-performance of the top three. When it came time to vote, did the calculus change with regard to electability, gender (yes, this still matters) or experience? In fact, campaign strategists may look to these numbers to plan for the future.
One could argue that the top three over-performers had more substance than style, while the bottom three -- excluding Huntsman -- had more style (and stumbles) than substance.
While Iowa didn't set the political season on fire, it certainly got the party started.