
It's time to take a look at the presidential horserace once again, using the smartest metric available: Electoral Votes (EV) charted over time. The last of these columns ran two weeks ago, and we've had lots of movement to cover since then, as 14 states shifted around on the map.
In contrast to last time around, the past two weeks have been mostly bad news for Hillary Clinton. Not terrible news, but certainly not good, as she's seen several states weaken considerably and has lost two over to the Trump column, at least for now.
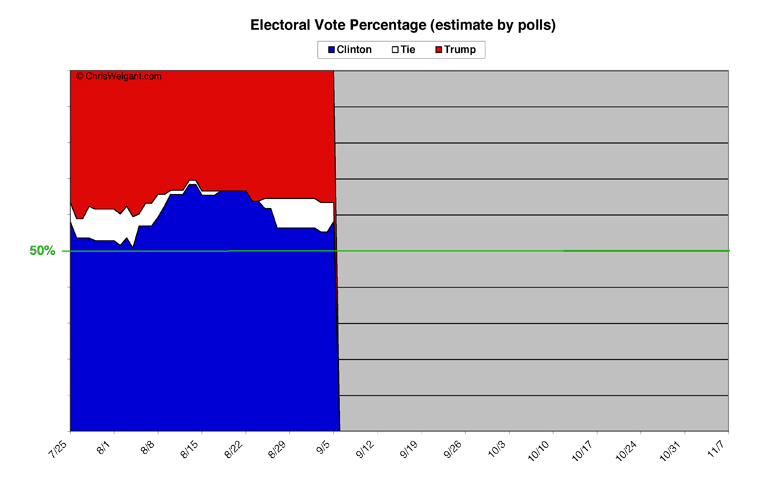
Let's start with the big picture. You'll note that while Clinton's total has gone down, Donald Trump's hasn't really improved that much. This was due to two big states moving only into the "tied" column (white on this graph). As always, Clinton starts from the bottom and Trump starts from the top, and whichever color crosses the halfway mark is ahead in the race for Electoral College votes.
[Click on any of theses images to see larger-scale versions.]
As things stand, Clinton still has a healthy 58 percent of the total, while Trump has 37 percent. In two weeks, Clinton has lost eight points while Trump gained three points. The extra five points is now in the tied category.
This shows the outsized influence of more-populous states. Only two states caused the rise in the tied category -- Florida and North Carolina. Together, they total 44 EV, which is why it shows up so clearly on the chart. Clinton was doing well in Florida two weeks ago, but it's been tied pretty much ever since. North Carolina moved from Clinton to Trump, then back to being tied, and only today has moved back towards Clinton once again. There's a reason they call them "swing states."
Clinton outright lost Iowa and Arizona during this period to Trump. Most of the rest of the movement wasn't quite as bad for her, but showed a weakening in several regions. Four states slipped in strength for Clinton (Michigan, Ohio, Virginia, and New Hampshire). Two states wobbled a bit, but then almost immediately recovered their support for Clinton in the end (Pennsylvania and Wisconsin).
Trump, during the same period, made some modest gains, which were balanced in part by some modest losses. I should mention that in the midst of this last period, polling became available from a 50-state poll conducted at the end of May, so several states that had previously had no polling data at all got some numbers, which caused at least some of this movement. This resulted in two states weakening for Trump (Montana and North Dakota), while Mississippi firmed up solidly behind Trump. Also, a recent poll in Kansas moved it into safe territory for Trump as well. The best news for Trump was that he picked up Iowa and Arizona from Clinton's column, but he has since weakened his support in Arizona. Trump briefly held North Carolina, but by the end of the period it had flipped back into Clinton's column again.
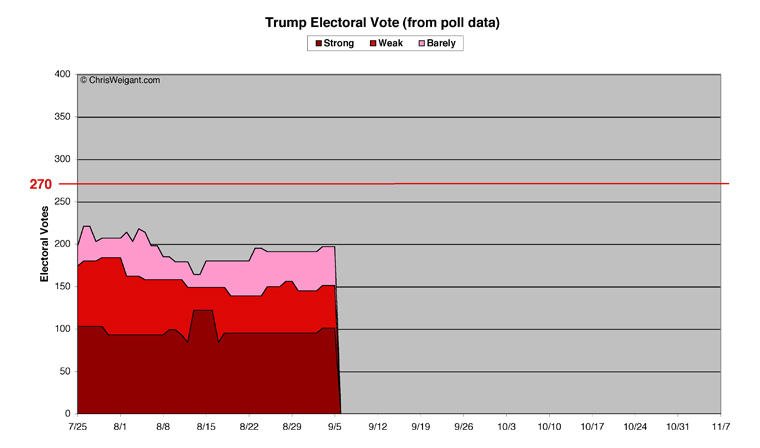
What this all means is that Trump's overall numbers didn't change a whole lot. Let's take a look at Trump's chart, broken down into the Strong, Weak, and Barely categories used at Electoral-Vote.com (where we get all our data from).
[Definition of terms: "Strong" means 10 percent or better in the polls,
"Weak" means five percent or better, and "Barely" is under five percent.]
As you can see, Trump's lines are pretty flat, even though he had a better two weeks than Clinton did (my previous column ran on August 23, so we're only talking about movement since then, on all of these charts).
Trump began with a decent step upwards, gaining North Carolina's 15 EV. He lost them a few days later, but on the same day flipped Arizona from Clinton. While North Carolina was only Barely Trump, Arizona started off Weak Trump. There was some reshuffling when Montana, North Dakota, and Mississippi all moved around due to the old polls from May, but it didn't have a whole lot of overall effect. This was also the point that Arizona moved back from Weak Trump to Barely Trump. At the end, Kansas moved up to Strong Trump, while Iowa flipped from Clinton all the way to Weak Trump.
Trump's overall total improved from 180 EV to 197 EV, with the addition of Arizona's 11 and Iowa's 6 Electoral College votes. Within the categories, Trump's numbers didn't change much, however. He started at 95 EV Strong Trump, and ended at 101 EV. Weak Trump started at 44 EV and improved to 50 EV, and his Barely numbers edged up from 41 EV to 46 EV. So while there was some positive news for Trump, he's still got a long way to go.
I'm always most interested in the "Strong Plus Weak" metric, which shows how many votes a candidate can comfortably count on (an advantage in the polls of at least five percent). Trump started this period at his low point for Strong Plus Weak, at only 139 EV. He rose briefly to 156 EV but then slipped back to 151 EV at the end. This is 119 EV short of the goal, to put it another way. Even when adding in the Barely Trump states, he's still short of 200 EV, so he's got a lot of ground to make up.
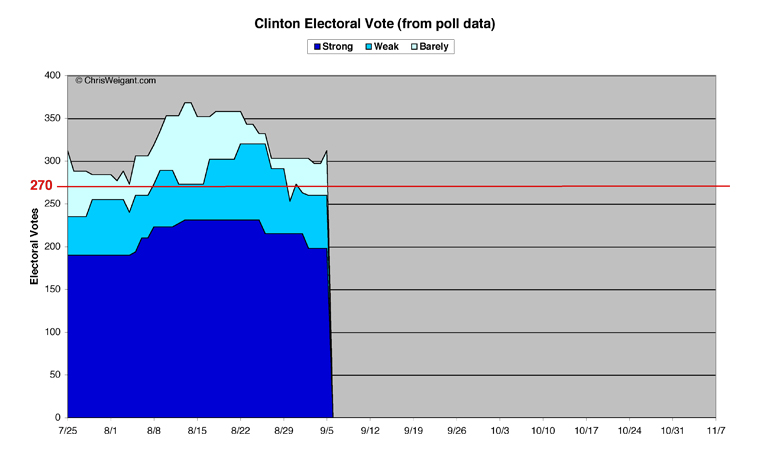
Now let's take a look at how Hillary Clinton is doing.
Unlike Trump, Clinton began this period at a high point. Since then, however, she's seen a weakening of her position overall, as is clearly shown on that chart. Clinton had two big steps down in the Strong category, as she lost Michigan down to Weak, and then both Virginia and New Hampshire on the same day (Virginia all the way down to Barely). Just in Strong, Clinton fell from 231 EV down to 198 EV within the last two weeks. But to put this in a little perspective, this is still one vote more than all of Trump's categories combined.
Weak Clinton saw a lot more movement within it. Two states (Wisconsin and Pennsylvania) briefly dropped down to Barely Clinton, but then recovered the following day. In general, there is more polling done in swing states, which is one reason why they shift around faster than others. As noted, Michigan and New Hampshire both fell from Strong Clinton to Weak during the period. But the worst news was Ohio and Florida falling out of the Weak Clinton category -- Ohio down to Barely Clinton and Florida all the way down to being tied. Weak Clinton started at 89 EV, rose briefly to 105 EV, fell down to 38 EV, then partially recovered back to 62 EV.
The Barely Clinton category was pretty volatile as well over the last two weeks. The biggest blow was losing Arizona's 11 EV all the way to Weak Trump, and a bit later losing Iowa's 6 EV to Trump as well. As already noted, Ohio and Virginia both wound up in Barely, Ohio down from Weak and Virginia down from Strong Clinton. But Clinton did have one bit of good news here, as North Carolina started the period off by moving from Barely Clinton to Barely Trump, then was tied for a while, but today has moved back to Barely Clinton, giving her a 15 EV spike to end on. Clinton started with 38 EV in the Barely column, but this rose to finish at 52 EV.
Clinton's overall total took a big hit in the past two weeks, falling from 358 EV at the start down to a low of 297 EV, but rising today back to 312 EV. This was due to the loss of 17 EV to Trump (Iowa, Arizona) and Florida (29 EV) and North Carolina (15 EV) being tied for much of the period. Even without Florida, however, Clinton would still win by 42 EV if the election were held today and all the polls were correct, so things aren't quite as bad as some in the media are saying.
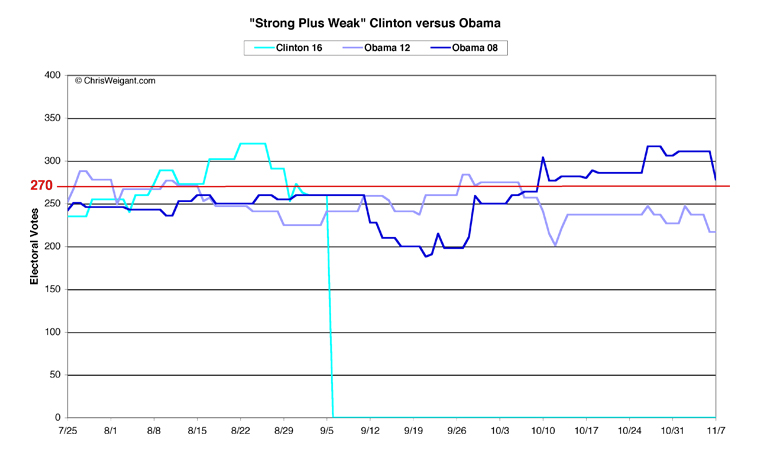
Which brings me to a new chart I created after writing my previous Electoral Math column. I noted at the time that Clinton was doing better in the Strong Plus Weak category than Barack Obama had ever managed in both his presidential runs. So I charted Clinton's Strong Plus Weak numbers (so far) against both the 2008 and 2012 Obama campaigns. Here is the result.
As you can see, Clinton was enjoying a high point two weeks ago, with a whopping 320 EV in Strong Plus Weak alone -- 50 more votes than she needs to win. Again, this was higher than Obama hit, even during the final weeks of his historic 2008 run. Since then, Clinton has fallen 60 EV in this combined category, putting her at 260 EV. But historical context shows that this was exactly where Obama was during the same time period in 2008, and furthermore Clinton is 19 EV above where he was during the 2012 campaign. Even in 2008, Obama fell below 200 EV in this category at the end of September, only to come roaring back in the final month.
I won't be running this chart in every Electoral Math column, but I did think it was helpful to put Clinton's relative strength into perspective. She is still only 10 EV shy of victory in states where she's up by at least five percent, meaning picking up only one or possibly two of the swing states will put her over the top in November. And Trump is currently barely over 150 EV in this category.
My Picks
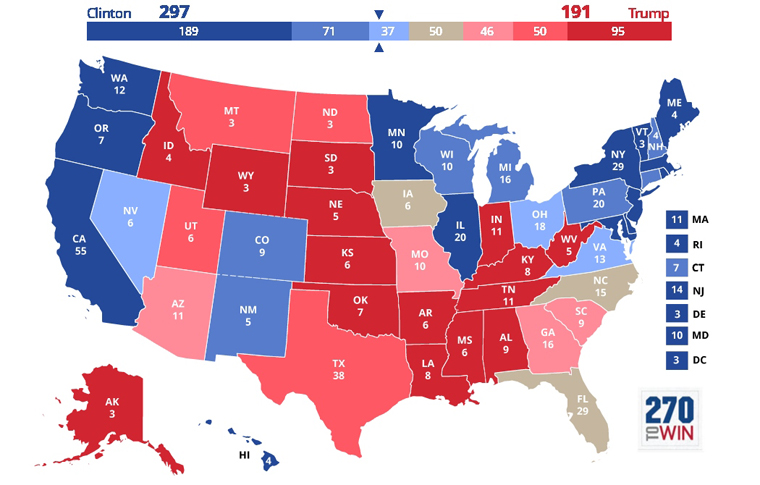
Which brings us to the part of the program where my gut feelings come into play, in addition to all this raw polling data. I break down all the states into Likely (Safe plus Probable) and Tossup (Leans Clinton or Trump, plus those truly Too Close To Call), as always. Here's my new map, courtesy of the folks at 270toWin (where you can create your own maps, if you'd like to reference them in the comments section). Also please note at the end of the column I've provided full lists of each of my categories, with their Electoral College vote totals.
Likely States -- Clinton
Safe Clinton (15 states, 189 EV)
The Safe column for Hillary Clinton grew by one state this time around, as I'm convinced that Minnesota is a lock for her. In fact, I'm not even sure why I ever thought otherwise. The rest of this list of bluer-than-blue states remains the same.
Probable Clinton (7 states, 71 EV)
Clinton lost two states from this category, one of them good news and one of them bad news. As already noted, Minnesota moved up, but it appears I was a wee bit overconfident of Virginia last time around, so I am moving it back down to just Leans Clinton, at least for now. This leaves 22 states in either the Probable or Safe categories for Clinton.
Likely States -- Trump
Safe Trump (15 states, 95 EV)
All the movement within the Safe Trump column is a result of the polling data from the end of May. This was at the end of the primary season, and it is quite likely all of the states I'm moving around will be solidly for Trump in November, I should mention. Trump lost two in this category, and gained two. Both Montana and North Dakota moved down to Probable Trump, but Kansas and Mississippi take their place as they move up from Probable to Safe for Trump.
Probable Trump (4 states, 50 EV)
All the movement within Probable was due to the new polling as well, as Kansas and Mississippi moved up to Safe, and Montana and North Dakota moved down to Probable (joining Texas and Utah, which didn't move this week). The upshot is that Trump has the same 19 states that he can likely count on in November in both these categories.
Tossup States
Leans Clinton (3 states, 37 EV)
Two big states shifted in the Leans Clinton category this time around, and both of them were bad news for her. Florida moved all 29 EV down to "Too Close To Call," while Virginia fell from Probable Clinton down to just Leans Clinton. This leaves three states leaning towards Clinton this week, as Virginia joins Nevada and Ohio in this category.
Leans Trump (4 states, 46 EV)
Both Missouri and South Carolina remained in the Leans Trump category this week, in addition to newcomers Arizona and Georgia. Both Arizona and Georgia were previously in Too Close To Call, but for now have to be considered leaning towards Trump. New polls could change this -- especially since Hillary Clinton is about to spend some money contesting Arizona -- but for now I've got to put them in Trump's column.
Too Close To Call (3 states, 50 EV)
Only three states are true tossups this week, and a case could even be made that Iowa really belongs in Leans Trump, as the last poll showed him up five points. But Iowa is notoriously volatile, so for now I'm leaving it as a big question mark. Iowa's 6 EV are probably not going to make much difference, but the other two states here have a whopping 44 EV between them. Florida was previously listed as Leans Clinton, but has remained tied through several polls, so it obviously could go either way. North Carolina just today had a poll showing Clinton up, but it's been swinging back and forth and will likely do so again. This category did lose two states this week, as Arizona and Georgia both moved to Leans Trump, at least for now.
Final Tally
It has been a rough few weeks for Hillary Clinton, as she has outright lost two states and had several others weaken considerably. Now, part of this may be due to pollsters making a shift that they always make around this point in a presidential election -- they start only reporting "likely voter" totals in their polls, attempting to screen out those who probably won't show up to vote on Election Day. This is tricky to do, because who knows how many new voters will actually cast a ballot this time around? Screening for likely voters usually consists of asking "Have you voted in the last two elections?" or similar questions. But there's always a shift in the numbers as the pollsters begin trying to get as accurate as possible for November.
While Clinton had a relatively bad few weeks, this didn't translate into a good few weeks for Trump. Most of the damage to Clinton's totals was caused by only two states (North Carolina and Florida), and neither of them moved into the Trump column (they both stayed tied for much of the past two weeks).
Donald Trump ended the period with the same 19 states firmly in his corner that he started with, for a total of the same 145 EV. Hillary Clinton now has 22 states that will likely vote for her, a loss of only one (Virginia) from last time around. This adds up to 260 EV, leaving her only 10 EV short of winning.
Ten states remain true battlegrounds, with 133 EV between them. Four lean towards Trump, and three lean towards Clinton. But out of these 10, Clinton will win the presidency if she wins any one of the seven states with 10 or more EV (Nevada and Iowa have only 6 EV, while South Carolina has 9 EV). Donald Trump, on the other hand has to win nine out of ten of the battlegrounds to have any path to victory whatsoever. Even if you add in all the Leans Trump states to his total, he only comes out with 191 EV -- still almost 80 votes short of victory. That's a pretty daunting hill for him to climb, and it's why even with the slippage Clinton saw this time around, she still remains the clear favorite to win the White House in November.
[Electoral Vote Data:]
(State electoral votes are in parenthesis following each state's name. Washington D.C. is counted as a state, for a total of 51.)
Hillary Clinton Likely Easy Wins -- 22 States -- 260 Electoral Votes:
Safe States -- 15 States -- 189 Electoral Votes
California (55), Delaware (3), Hawaii (4), Illinois (20), Maine (4), Maryland (10), Massachusetts (11), Minnesota (10), New Jersey (14), New York (29), Oregon (7), Rhode Island (4), Vermont (3), Washington (12), Washington D.C. (3)
Probable States -- 7 States -- 71 Electoral Votes
Colorado (9), Connecticut (7), Michigan (16), New Hampshire (4), New Mexico (5), Pennsylvania (20), Wisconsin (10)
Donald Trump Likely Easy Wins -- 19 States -- 145 Electoral Votes:
Safe States -- 15 States -- 95 Electoral Votes
Alabama (9), Alaska (3), Arkansas (6), Idaho (4), Indiana (11), Kansas (6), Kentucky (8), Louisiana (8), Mississippi (6), Nebraska (5), Oklahoma (7), South Dakota (3), Tennessee (11), West Virginia (5), Wyoming (3)
Probable States -- 4 States -- 50 Electoral Votes
Montana (3), North Dakota (3), Texas (38), Utah (6)
Tossup States -- 10 States -- 133 Electoral Votes:
Tossup States Leaning Clinton -- 3 States -- 37 Electoral Votes
Nevada (6), Ohio (18), Virginia (13)
Tossup States Leaning Trump -- 4 States -- 46 Electoral Votes
Arizona (11), Georgia (16), Missouri (10), South Carolina (9)
Too Close To Call -- 3 States -- 50 Electoral Votes
Florida (29), Iowa (6), North Carolina (15)
Polling data gaps:
Polled, but no polling data since the primaries -- 16 States
(States which have not been polled since the beginning of June, with the dates of their last poll in parenthesis.)
Alabama (5/31), Alaska (5/31), Hawaii (5/31), Kentucky (5/31), Louisiana (5/31), Maryland (5/31), Massachusetts (5/31), Minnesota (5/31), Mississippi (5/31), Montana (5/31), Nebraska (5/31), North Dakota (5/31), Rhode Island (5/31), South Dakota (5/31), Washington D.C. (5/31), Wyoming (5/31)
No polling data at all, yet
(States which have not been polled so far this year.)
[None -- a state-by-state internet poll was conducted on May 31 in all states]
Chris Weigant blogs at:
Follow Chris on Twitter: @ChrisWeigant