

You may have read or heard that "the Undecided Voter is a myth, or at least, that the ranks of the undecided are so small that they are not the most important group in the election.
Both arguments are largely true.
Just 3 percent of registered voters and 2 percent of likely voters interviewed this past week for SurveyMonkey's Election Tracking were undecided. They did not answer when asked to choose between Democrat Hillary Clinton, Republican Donald Trump, Libertarian Gary Johnson and Green Party nominee Jill Stein. As other surveys also find, this small slice of the electorate is generally less engaged in politics and less likely to vote.
However, the relatively small size of the "undecided" category masks much more uncertainty among voters who have a preference between Clinton and Trump, but are not happy with either, and are weighing whether to vote for a third party candidate or perhaps not vote at all. These conflicted voters are crucial targets for the two campaigns.
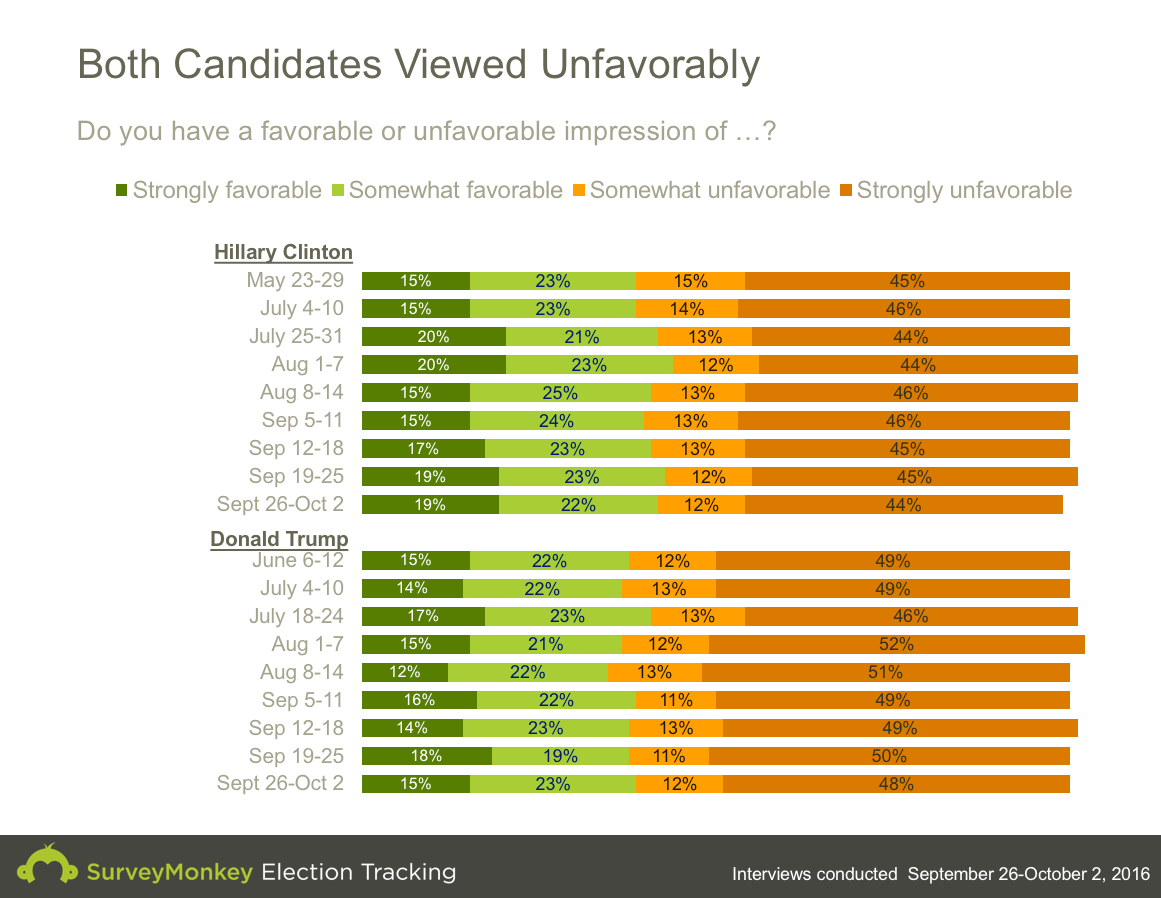
We have reported twice previously on this phenomenon, dividing up the electorate based on the separate favorability questions we periodically ask about Clinton and Trump. To review: Both Clinton and Trump receive net negative ratings. Over the past week, registered voters nationwide rated Clinton 42 percent favorable, 57 percent unfavorable, and Trump received a rating of 38 percent favorable and 60 percent unfavorable. The favorable ratings of both candidates have ticked up a point in the last two weeks, while their unfavorable ratings of both have declined by a point.
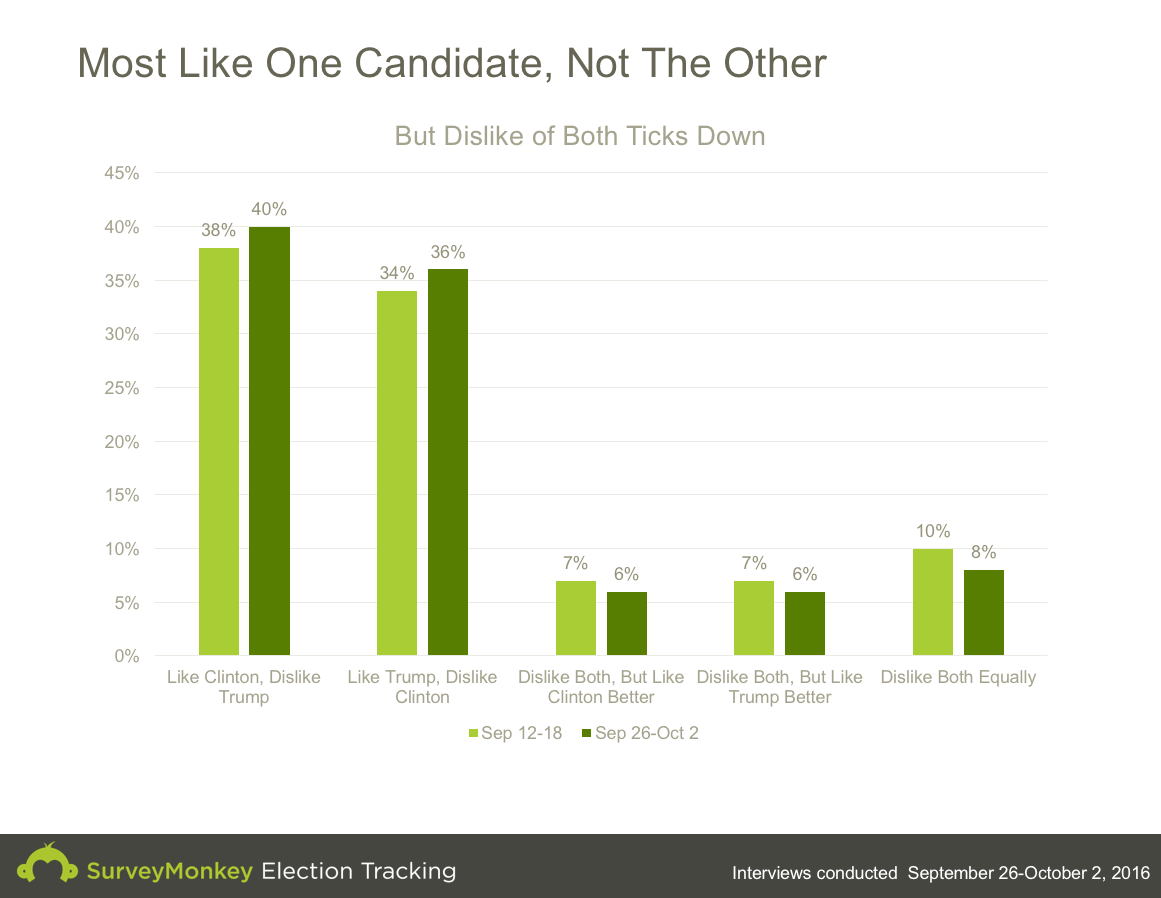
Although the candidates' negative ratings are unusually high, the vast majority (76 percent) like one and dislike the other. More specifically, 40 percent rate Clinton favorably and Trump unfavorably, while 36 percent rate Trump favorably and Clinton unfavorably. Consistent with the change in the individual ratings, the size of each group has ticked up two percentage points over the past two weeks. In other words, as the campaign progresses, some voters with misgivings are warming up to their preferred candidate.
The Decided
The voters who like Clinton and dislike Trump -- or vice versa -- are overwhelmingly decided between either Clinton or Trump, heavily partisan, mostly certain of their choice and highly likely to vote.
Those who like Clinton and dislike Trump opt for Clinton overwhelmingly on both vote questions, whether matched against just Trump (98 percent) or against Trump and third-party candidates (93 percent). They heavily identify or lean Democratic (89 percent), and nearly all (88 percent) say there is a "large chance" or better they will vote for Clinton. Nearly all (94 percent) say there is a "large chance" or better they will vote in this election.
Those who like Trump better than Clinton are similarly decided for Trump, whether matched against just Clinton (98 percent) or also against Johnson and Stein (96 percent). They overwhelmingly identify or lean Republican (88 percent). Most say there is a "large chance" or better they will vote for Trump (93 percent) and cast a ballot in the election (96 percent).
So again, better than three quarters of registered voters are very much decided.
The Uncertain
That still leaves 20 percent of registered voters who dislike both, but with an added wrinkle. Most of these conflicted voters (12 percent overall) dislike either Clinton or Trump more intensely than the other, and when pressed to vote for one of the two, most express preference, with 41 percent voting for Trump and 36 percent voting for Clinton. Despite their preference, many are still undecided, but not so much between Trump and Clinton as whether to opt for the candidate they perceive as the lesser of two perceived evils, opt for a third-party candidate or not vote at all.
When presented third-party options, for example, many currently choose either Johnson (31 percent) or Stein (9 percent), leaving Trump and Clinton with just 27 and 25 percent support respectively. Yet only 30 percent say they are absolutely certain they'll end up voting for their stated preference. And when it comes to voting itself, while 69 percent are absolutely certain to vote, that number is far lower than among those who like one candidate and dislike the other (89 percent).
What will they do?
Some shifts are already underway. First, as noted above, the number who dislike both candidates has dropped by four percentage points (from 24 to 20 percent) in just the last two weeks.
Second, among those who still dislike both candidates, support for Johnson and Stein has dropped slightly, with support rising for Clinton and Trump on the four-way choice.
To be more specific, among those who dislike Clinton less than Trump (who rate Trump strongly unfavorable, but Clinton only somewhat unfavorable), support for Clinton has increased from 60 to 67 percent over the past two weeks. Among those who dislike Trump less intensely than they dislike Clinton, Trump's vote has increased from 61 to 65 percent.
Did the first debate make a difference?
While their numbers are smaller than the fully decided, the majority of these conflicted voters (62 percent) report that they watched the first Clinton-Trump debate, with most of the rest (23 percent) reporting that they followed news coverage about the debate. More than a third (36 percent) said that they "visited a fact-checking site" either during or after the debate.
While the debate may have left these voters with negative ratings of both candidates, they made very different impressions on their respective targets among these conflicted and persuadable voters.
Specifically, those who dislike Clinton less than Trump may still give her a "somewhat unfavorable" rating, but an overwhelming majority (76 percent) said she won or did the best job at the debate. Over a third (34 percent) said their impression of Trump "changed for the worse," and nearly as many (30 percent) said their impression of Clinton changed for the better.
In contrast, Trump did little or nothing at the first debate to reassure these arguably persuadable voters who dislike Trump less than they dislike Clinton: Only 10 percent judged him the debate winner and only 12 percent said their opinion of him changed for the better (though 26 percent said their opinion of Clinton changed for the worse) .
Viewed through these data, both candidates are targeting different groups of conflicted voters. So far, at least, Hillary Clinton has used the debates to lessen doubts about her among a critical target group. Donald Trump has not among his.
This SurveyMonkey Election Tracking survey for September 26th, 2016 through October 2nd, 2016 was conducted online among a national sample of 28,913 registered voters. Respondents for this survey were selected from the nearly 3 million people who take surveys on the SurveyMonkey platform each day. Data for this week have been weighted for age, race, sex, education, geography, and voter registration status using the Census Bureau and Bureau of Labor Statistics' Current Population Survey to reflect the demographic composition of the United States. An additional smoothing parameter for ideology based on previous Election Tracking interviews is included.
This entry is cross-posted at the SurveyMonkey Election Tracking Blog