
WASHINGTON -- Could the polls be wrong? That's a question I've been asked often in recent months, mostly by Democrats hoping that the dire forecasts produced here and elsewhere turn out to be too pessimistic. The short answer is of course they can. In an era of low response rates, imperfect sample coverage and a host of new polling technologies, nothing is certain. At this hour however, the most likely range of that error lies somewhere between a Democratic defeat comparable to 1994 and something much more severe.
Before we review our final round of polling forecasts based on whatever final polls straggle in this morning, let's take a few minutes to ponder that question a little more carefully. Every polling average on HuffPost Pollster and our Election Dashboard, and every probability we have calculated on the outcome, rests on the assumption that, as a whole, the underlying polling is statistically unbiased.
Are pre-election polls often widely variable? Yes, but averages and the "trend estimate" numbers we publish assume that most of the variation, whether based the errors involved in measuring a sample rather than the entire population, or based on subjective survey design decisions that pollsters make, from question wording to identifying the likely electorate, is random. If we average out the various polls, we minimize that random error and get a more accurate forecast. At least that's the operating assumption.
Polling aggregators -- from Bill Schneider and his CNN "poll of polls" in the 1990s to the RealClearPolitics averages, to sites like Pollster.com and FiveThirtyEight -- have succeeded because on the whole, pre-election polls over the last 15 to 20 years have been largely unbiased. If they have remained statistically neutral in recent weeks, then the estimates we have produced will be reasonably accurate.
There have certainly been examples within recent memory when the aggregate of polling had a statistical bias. There was the 2008 New Hampshire primary, when the final round of polls all showed Barack Obama leading Hillary Clinton, missing her ultimate victory. The leaked exit polls of 2004 also proved to have just enough statistical error favoring the Democrats to give everyone the wrong impression about the likely winner.
So could the polls be collectively wrong tonight? The discomforting thought for pollsters is that some surveys are clearly wrong at the national level and we have seen evidence for weeks of more subtle divides at the state level. As we noted yesterday, the final round of polls measuring the "generic" vote preference for the U.S. House -- the question that asks voters whether they prefer the Democrat or the Republican candidate for Congress in their District -- has produced a wide array of results ranging from dead even to the fifteen point, historical blowout forecast by the Gallup Organization.
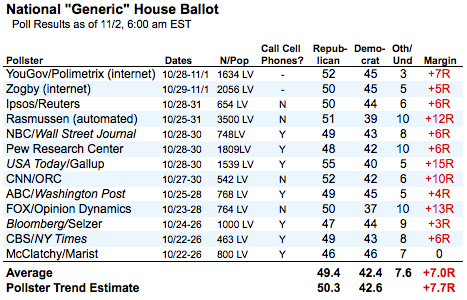
Put simply, some of the forecasts on this table are inaccurate, though we will not know which ones until we have the full results.
We have also seen similar though usually less stark divides in recent weeks at the state level. For most of the fall, for example, the West Virginia senate race has produced two distinct narratives. One, driven by Rasmussen Reports' automated polls and the methodological clones produced by Rasmussen's Pulse subsidiary for Fox News, has shown Republican John Raese narrowly leading Democrat Joe Manchin up until the past week. The other, driven by virtually every other pollster active in the race, has given Manchin a narrow lead for much of the fall. Recent polls have converged, but both narratives of the race were not simultaneously accurate.
Washington -- the state whose close contest may well determine control of the Senate -- has demonstrated a similar divergence between polls (mostly using live interviewers) that have Democrat Patty Murray leading narrowly and others (mostly using automated methods) that have shown a much closer race. Again, those differences have recently converged to a degree, but either one narrative or the other has been the true story of the race, not both.
And these are just two of the most competitive and thus closely watched contests. Our colleague David Wilson points out a similar polling divide in the Delaware Senate race and there are likely similar patters lurking elsewhere.
So is it possible that our final polling "trend estimates" and win probabilities are providing a misleading picture of the outcome? Is it possible that the recent history of largely unbiased statewide state and Congressional polling will collide tonight with a one-sided wave of error? Yes, although the range of recent national poll results suggests that any such errors at the state level will favor Republicans.
The big divergence at the national level appears to result mostly from the way the significant enthusiasm gap separating Republicans and Democrats is interacting with pollsters' likely voter models. Consider this powerful bit of analysis from the Pew Research Center:
[T]he Republicans enjoy a substantial engagement advantage. The GOP's overall [48% to 42%] lead is only evident when the sample is narrowed to likely voters. Among all registered voters, preferences are about evenly divided - 44% Democrat, 43% Republican.
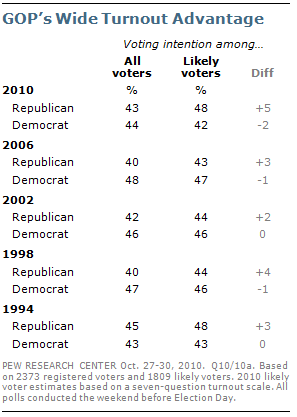
This represents one of the largest gaps in preferences between all voters and likely voters ever recorded in Pew Research Center surveys. As was the case earlier in the campaign, this is more a consequence of unusually high engagement among Republicans than disengagement among Democrats. Since September, a growing number of Democrats say they have given a lot of thought to the election, but they still lag Republicans by a wide margin. The current levels of Democratic engagement are fairly typical for a midterm election, though they are somewhat below what they were in 2006, when the party regained control of Congress.
My operating theory is that some likely voter models have been more sensitive to this gap than others, which is why even polls using very similar methodologies at the national level (like ABC News/Washington Post, Pew Research and Gallup) have produced such widely varying results.
The other big potential source of error and divergence comes from the challenge of using telephone polls to reach voters who use only mobile phones. A much discussed Pew Center report released last month found that polls samples based on landline phones alone may produce a bias favoring the Republicans of roughly five points on the margin on the national "generic" House vote.
At the national level, however, many national surveys are now using dual samples to reach voters on both landline and cell phones. It is probably not a coincidence that three of the biggest Republican leads on the national "generic" House vote were produced by pollsters (Rasmussen Reports, CNN/ORC and Fox/Opinion Dynamics) that are not calling cell phones. The average Republican margin on the four national surveys that are limited to landline phones is nearly ten points (50.7% to 41.0%) compared to a slightly better than six-point lead on the seven surveys that called on both landline and cell phones (49.3% to 43.2%). And the two internet panel surveys have produced Republican margins -- +7R for YouGov/Polimetrix and +5R for Zogby -- that are roughly consistent with landline/mobile telephone surveys
Democrats can take small comfort from the fact that the closer national margins are generally more consistent with our trend estimates in individual Senate and House races. Our House poll estimates currently point to a 48-seat gain by the Republicans. That is a slightly more optimistic projection than what the political science models would project from a six to seven-point lead on the national generic House vote, which might translate into a fifty to sixty seat gain for Republicans, depending on the model.
However, as Nate Silver points out, a very small bias in the House polling could easily alter our the seat counts produced by averaging District level polling. Our trend estimate charts show 30 districts where one candidate is leading by two percentage points or less, so a very small bias in the House polling could produce a big shift in the seat count.
But let's not get too caught up in the uncertainty. In 24 hours we will have a much better idea how the polls fared this year. For now, however, the forecast is clear: Republican will make major gains in both the House and Senate, at least as significant as in 1994 and possibly greater.