
Welcome to the kickoff of my quadrennial "Electoral Math" column series. I've been writing these since 2008, because I've always been astonished that no other statistics guru out there seems to present the presidential race in the way that makes the most sense -- by Electoral College vote, charted over time.
National polls are almost useless in predicting the outcome of the presidential race. "Nationwide, Hillary Clinton is up by four points" tells you precisely nothing about her chances of actually winning the presidency, because (as Al Gore could certainly tell you) the popular vote is completely meaningless in how we actually choose our presidents. Instead, it's all about the Electoral College.
This requires more data and more analysis than most pundits are willing to do. Thankfully, there's a wonderful site that devotes itself to tracking state-level presidential polling, Electoral-Vote.com. They were the only ones around who bothered, eight years ago. While other websites have caught up with them, they still provide the most data possible in a very easy-to-read format, so I'm going to continue to use their data for the 2016 election cycle.
But while it's fun to check in with their site to see how the states are shifting around, all they provide is a daily snapshot in time -- the map for any particular day showing which candidates are ahead in which states. The Electoral Math columns take this one step further, and chart this data over time, so you can see in one chart how the race is changing.
As always (for those familiar with this column series from previous elections), we've first got to take a look at the updated charts, then I'll provide my own picks (applying some gut feeling to the raw polling numbers) before providing all the data at the end. So let's get started with the first graphs of the 2016 season.
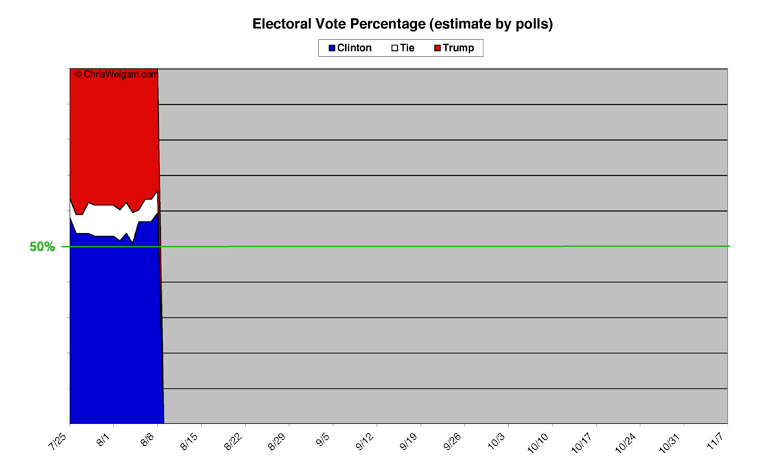
The first chart is the "big picture" overview. If you assume all the state-level polling is correct (even the close ones), how close to a winning percentage of Electoral Votes (EV) is either candidate? Hillary Clinton, in blue, starts from the bottom of the chart. Donald Trump, in red, starts at the top of the chart. States which are tied are the white area in between. If the blue is above the halfway line, Hillary will win. If the red is below the line, Trump will win. Here's the initial chart for 2016:
[Click on any of theses graphs to see larger-scale versions.]
Before I get to this chart, a few bits of context may be helpful. If you'd like to compare the previous two presidential elections, take a look at my final report from 2012, and my final column from 2008, to see fully-filled-in charts (from the day before Election Day). However, one technical note: this year, Electoral-Vote.com started providing data a lot later in the year than before. So while this year's charts start on July 25th, the charts for 2012 started at the beginning of May and the 2008 charts started in early June. So be sure you're looking at the comparable date when measuring this year's race against the past two.
The new 2016 percentage chart shows Hillary Clinton currently comfortably over the margin of victory, with 59 percent of the possible 538 Electoral Votes. Donald Trump currently only has 34 percent of the EV needed to win, with the remaining 6-plus percent tied (in Georgia and Ohio). The next two charts break down each candidate by how strongly they are polling at each state's level. First, Hillary Clinton:
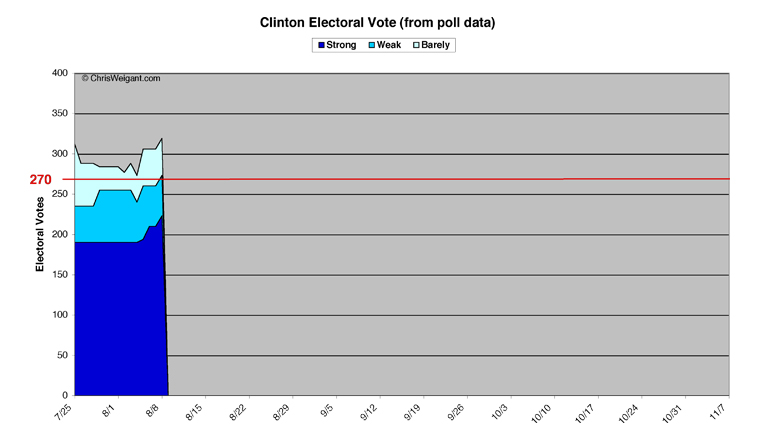
Clinton's overall total started at 312 Electoral College votes (270 are needed to win). Her numbers fell back a bit, bottoming out late last week at 273 EV, but then they rose once again to end up at 319 EV today. This puts her comfortably between where Barack Obama was at this point of the race in 2012 (332 EV), and 30 points ahead of where Obama was in 2008 (289 EV).
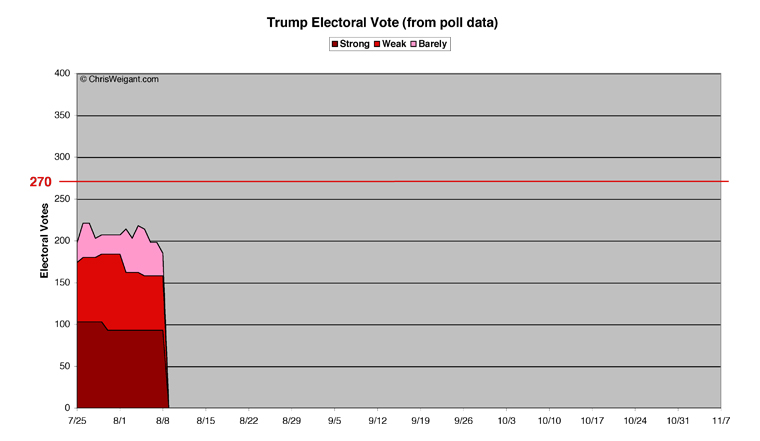
Donald Trump, on the other hand, is doing worse overall (at only 185 EV) than either Mitt Romney was (206 EV) or John McCain was (236 EV) at the same point. Trump's highest point so far was 221 EV, and he's currently at the lowest point he's yet charted. But that's only taking into account the overall total for both Trump and Clinton, without breaking the two candidates' support down by how strong their margins are in each state's polls.
In each of the two charts above, three colors are used. The darkest is "Strong" support, defined as a 10-point (or better) lead in each state. The middle section is "Weak" support, defined as leading by five percent or better, but still in the single digits. And the lightest color is are states that are "Barely" for one candidate or the other, meaning a lead of less than five percent.
Over the past couple of weeks (since the data became available), Hillary Clinton has improved -- most notably in the past few days. Strong Clinton states added up to 190 EV until last Thursday, when first New Hampshire, then Michigan, and (today) Virginia moved into this column for her, leaving her with 223 EV just in Strong Clinton states alone (which is less than 50 EV from the winning 270 number). But while Michigan has always been blue, the race might be closer than expected there. Also, Virginia and New Hampshire have switched back and forth from Clinton to Trump already, so it's far too early to count them as locks for Clinton at this point.
In the Weak category, Clinton started at 45 EV, rose to 65 EV with Pennsylvania firming up, but then fell to 50 EV when North Carolina went from Weak Clinton to Barely Trump. The Barely Clinton category was more volatile (which is normal), ranging widely between 22 and 77 EV. Four states improved from Barely Clinton to either Weak or Strong Clinton: Michigan, Pennsylvania, New Hampshire, and Virginia (although those last two went over to Trump before firming up for Hillary). Arizona moved to Barely Clinton from Barely Trump, and Florida went from being tied to Barely Clinton as well. Nevada swung between Barely Clinton and Weak Trump, and then it swung back again. Ohio wavered between Barely Clinton and Barely Trump before ending up in a tie.
Donald Trump, during this same period, saw his Strong category go down from 103 to 93, when Missouri moved down (but only to Weak Trump). Trump's Weak category started at 71 EV, climbed to 91 EV, and then fell back again to 65 EV. Georgia started out Weak Trump but is now tied (some polls even show Clinton ahead here, but the Electoral-Vote.com average has them tied). New Hampshire and Nevada were briefly Weak Trump before going back to Clinton. Trump's Barely category bounced around from 23 EV to 56 EV, and currently stands at 27 EV. Trump lost Arizona to Clinton from Barely Trump. Ohio, Georgia, and Virginia all spent some time in Barely Trump before becoming tied (Ohio and Georgia) or moving to Strong Clinton (Virginia). The only really good news for Trump was seeing North Carolina move from Weak Clinton to Barely Trump.
That's a lot of wonky data to follow, so I've found that the best way to gauge how candidates are doing (given these three categories) is to track closely the line of "Strong Plus Weak." Ignore the Barely (and tied) states, as they could go either way, but watching Strong Plus Weak shows which states the candidates can feel are safely theirs. Using this measure, Trump has been losing ground, from a high of 184 EV down to a low of 158 EV today. That is 112 EV short of winning the race.
Hillary Clinton, however, just passed a milestone. Her Strong Plus Weak line started at 235 EV, and has been pretty steadily improving since then. The last few days have seen it climb to 273 EV -- which is three more than is needed to win the presidency. To put this another way, if Hillary lost all her Barely states (Nevada, Arizona, Florida) and the states which are now tied (Ohio, Georgia), she would still win the race. That's a pretty comfortable place for any candidate to be in.
To put this in some context, Barack Obama didn't hit this milestone until the first week of October in 2008 (after which it never fell below the 270 EV mark again). In 2012, Obama only briefly reached this mark for four short periods during his campaign, and on Election Day he wasn't even close -- his Strong Plus Weak level was only at 217 EV. At this point in the previous elections, Obama's Strong Plus Weak number was at 267 EV in 2012 and at 236 EV in 2008.
My Picks
A big caveat is necessary when relying on poll numbers to draw conclusions, and that is that sometimes the polls are wrong. Who knows what this election will look like, with third-party candidates polling in double digits and the unconventional nature of Trump's campaign? Also, one poll is never definitive, but that's how the states are colored on the Electoral-Vote.com map. So I always add a section here at the end where I try to apply some common sense to where each state actually is, rather than just what one poll may claim.
My categories here are similar, but add in my gut feelings to the process. Essentially I use three major categories: Likely Clinton, Likely Trump, and Tossup. Within the Likely categories, I break the list down to Safe and Probable for each candidate. Within the last category, I break it down to Leans Clinton, Leans Trump, and Too Close To Call -- the ones I won't even venture a guess on.
Below my picks (down at the bottom) are full lists of all the states I have in each category, along with their Electoral College votes. Also, there's a list of states which either have not been polled yet at all this election cycle, or have polling data older than the end of the primary season. The older a poll is, the less likely it is to be accurate, to state the obvious.
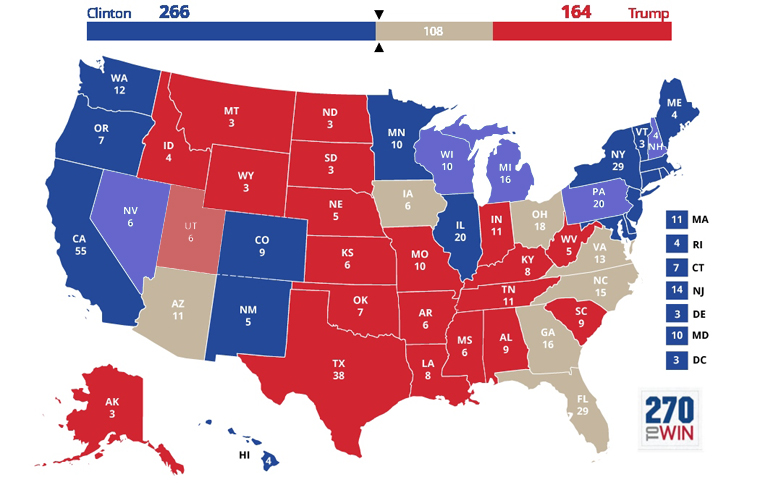
Here's a handy map of my picks (created at 270ToWin.com). Dark colors are Likely states, lighter colors are Lean states, and the true tossups are neutral.
Likely States -- Clinton
Safe Clinton (13 states, 172 EV)
Since this is the first column of the season, I'm going to be a little conservative in my picks, meaning I'm not giving states as high a ranking as their current polling may indicate. If the polling's been all over the map, then I want to see a string of polls showing similar results before I'll believe them, to put this another way. In Safe Clinton I would put all of the states now polling at 10 percent or better (the Strong Clinton states from the map on Electoral-Vote.com), with a few exceptions. Three states I left out because the polling from them is either so old (Oregon hasn't polled since May, Minnesota since April) or non-existent (New Mexico hasn't been polled at all). And three other states were left out because the polling has just not firmed up enough to believe that they are truly Safe Clinton states at this point: Michigan, Virginia, and New Hampshire.
Probable Clinton (5 states, 38 EV)
My initial picks for this category: Colorado, Connecticut, Minnesota, New Mexico, and Oregon. I think all of them may eventually move up to Safe Clinton, but for now I still have slight doubts about each of them. A few strong polls could easily allow me to move them up, though.
Likely States -- Trump
Safe Trump (16 states, 93 EV)
I didn't make any changes to the states listed as Strong Trump on the Electoral-Vote.com site. I think all of them are pretty safe for Trump right now, and likely won't change any time soon.
Probable Trump (4 states, 65 EV)
Four states were rated Probable Trump: Indiana, Mississippi, Missouri, and Texas. Indiana and Mississippi have been polling weaker than expected, but the polls are very old (March and April), so once someone gets around to polling them again, they'll likely firm up for Trump. In Missouri, Trump has already slid backwards in the polls a bit, although he's still got a comfortable lead. Texas has also been polling weakly enough to keep it out of the Safe Trump category, at least for now.
Tossup States
Lean Clinton (5 states, 56 EV)
Again, because this is the first column (without a whole lot of back data to refer to yet), there are a lot of states in all the Tossup categories. In Lean Clinton, we have five states. Michigan and New Hampshire are technically in the Strong Clinton ranks, but only because one poll in each (from the past few days) put Clinton up over 10 points. Before that, both states were a lot weaker (New Hampshire was even Weak Trump for a while). So I'm not convinced that they yet deserve to be higher than Lean Clinton. Pennsylvania and Wisconsin really should be at least Probable Clinton, but both are key battleground states this year so I'm hedging my bets and leaving them as only Lean Clinton for now. And Nevada is only Barely Clinton right now, but Democrats will likely have the edge by Election Day.
Lean Trump (1 state, 6 EV)
There's really only one state which I think could possibly be in play in November but which probably leans towards Trump right now, and that is Utah. Trump is not very popular with Mormons, so it might be a hard fight for him to take Utah, but at the same time it's hard to see it flipping all the way to Hillary, so Trump's got to be seen with the edge here.
Too Close To Call (7 states, 108 EV)
This is an abnormally high number of states that I refuse to predict, but again, it's only the first column of the election season, so things will doubtlessly get better later on. Three of these states are very familiar battleground states from the past few decades -- Florida, Iowa, and Ohio. At the moment, Clinton is up in Florida, Trump is up in Iowa, and Ohio is tied. Two of these states were added to the battleground mix by Barack Obama: North Carolina and Virginia. Currently, Trump has the lead in North Carolina and Clinton has a big lead in Virginia, but they've both already flipped back and forth between the candidates, so they still have to be seen as too close to call. The real news here -- and possibly the biggest news yet in the area of Electoral College math -- is that Hillary Clinton has already added two states to the list of battleground states: Arizona and Georgia. In Arizona, Clinton currently has a slim lead and Georgia is marked down as tied (although at least one poll put Clinton up by four points).
Final Tally
The question of which states are truly going to be battleground states this year is still an open one, but it certainly looks like the Democrats are having more success poaching Republican states than the other way around. Trump is going to have to defend Arizona, Utah, and Georgia, while (so far) his goal of poaching the Rust Belt (Pennsylvania, Michigan, Wisconsin) seems to be falling flat. Ohio is still competitive, but it almost always is. And even the fact that Virginia and North Carolina are close is testament to Obama's proven ability to expand the map in the previous two elections. Trump is doing better in Iowa and Nevada than past Republicans, but he really hasn't opened up the overall map enough to give him more than a very narrow path to the 270 EV he needs to win.
By my picks this week, Hillary Clinton has 18 states with 210 EV solidly in her corner. Donald Trump, on the other hand, has more states (20) but they only add up to 158 EV. This puts Clinton ahead by 52 EV very early in the game. Clinton still has 60 EV to make up to get her across the finish line, but she's got 56 EV at least leaning her way at this point. Trump has 112 EV to go to win, but currently only has the 6 EV from Utah leaning his way. We still have seven states with a whopping 108 EV which could go either way, so nothing is written in stone at this point.
But Clinton does have an enormous edge. Of the seven states which are too close for me to call, if Clinton wins any single one of them it puts her across the 270 mark. Trump, on the other hand, would have to win every single one of them to win -- he'd have to completely run the table. This is a normal spot for a Republican to be in, at least from the last six presidential elections -- the Democrats have had multiple paths to victory, while the Republicans have to barely eke out a win with only a few Electoral College votes to spare. At this point, I'd predict that if Hillary Clinton wins either Ohio or Florida in November, she will be our next president.
[Electoral-Vote.com Data:]
(State electoral votes are in parenthesis following each state's name. Washington D.C. is counted as a state, for a total of 51.)
Hillary Clinton Likely Easy Wins -- 18 States -- 210 Electoral Votes:
Safe States -- 13 States -- 172 Electoral Votes
California (55), Delaware (3), Hawaii (4), Illinois (20), Maine (4), Maryland (10), Massachusetts (11), New Jersey (14), New York (29), Rhode Island (4), Vermont (3), Washington D.C. (3), Washington (12)
Probable States -- 5 States -- 38 Electoral Votes
Colorado (9), Connecticut (7), Minnesota (10), New Mexico (5), Oregon (7)
Donald Trump Likely Easy Wins -- 20 States -- 158 Electoral Votes:
Safe States -- 16 States -- 93 Electoral Votes
Alabama (9), Alaska (3), Arkansas (6), Idaho (4), Kansas (6), Kentucky (8), Louisiana (8), Montana (3), Nebraska (5), North Dakota (3), Oklahoma (7), South Carolina (9), South Dakota (3), Tennessee (11), West Virginia (5), Wyoming (3)
Probable States -- 4 States -- 65 Electoral Votes
Indiana (11), Mississippi (6), Missouri (10), Texas (38)
Tossup States -- 13 States -- 170 Electoral Votes:
Tossup States Leaning Clinton -- 5 States -- 56 Electoral Votes
Michigan (16), Nevada (6), New Hampshire (4), Pennsylvania (20), Wisconsin (10)
Tossup States Leaning Trump -- 1 State -- 6 Electoral Votes
Utah (6)
Too Close To Call -- 7 States -- 108 Electoral Votes
Arizona (11), Florida (29), Georgia (16), Iowa (6), North Carolina (15), Ohio (18), Virginia (13)
Polling data gaps:
Polled, but no polling data since the primaries -- 5 States
(States which have not been polled since the beginning of June, with the dates of their last poll in parenthesis.)
Indiana (4/28), Maryland (4/17), Minnesota (4/27), Mississippi (3/30), Oregon (5/9)
No polling data at all, yet -- 18 States
(States which have not been polled so far this year.)
Alaska, Alabama, Hawaii, Illinois, Kentucky, Louisiana, Massachusetts, Montana, Nebraska, New Mexico, North Dakota, Rhode Island, South Carolina, South Dakota, Tennessee, Washington D.C., West Virginia, Wyoming
Chris Weigant blogs at:
Follow Chris on Twitter: @ChrisWeigant