
The FCC and the phone companies, AT&T and Verizon, have been manipulating the accounting of access lines and it is being used to create harmful public policies.
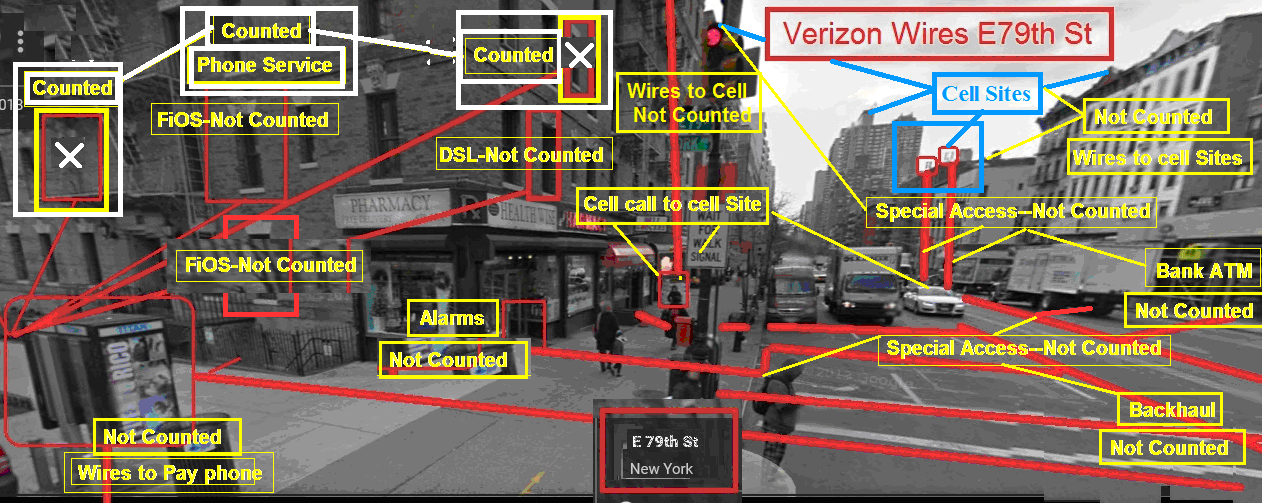
This is a panoramic Google Maps shot of E79th Street in New York City that shows the majority of wired access lines are NOT being counted. (This is just a 'representation'; each line represents hundreds/thousands of lines in the neighborhood.) -- I'll get back to this in a moment.
Verizon claims no one is using the networks so they should be able to shut them off, not maintain them, block competitors from using any upgrades, get rid of the unions, charge you more and force customers onto more expensive wireless... for starters - And more importantly, they have created a 'special' network with no accounting of actual lines, or oversight, but it was built using revenue from local phone rates.
How to Hide $40 Billion to 'Shut Off the Copper'?
At the end of 2007, the FCC's "Statistics of Common Carriers" showed that there were more than 424 million total access lines in America, and that the majority, over 300 million business broadband and data lines, were 'Special Access'. (There are caveats which we will discuss.) This was the last year the FCC published this report and information collection, which had started in 1939.
Special access lines are not "special"; they are part of the state-based telecommunications utilities and are business broadband and data lines.
In 2015, the FCC published some new data and claimed that special access revenues are about $40 billion and the majority, 60%, or $24 billion, are 'mostly-copper based' telecommunications ("TDM") services that are part of the state utility wires:
"TDM-based business data services... are the dedicated (usually copper) circuits that many business and other institutional users continue to rely on for their data and other communications needs... Despite the growth of newer technologies, preliminary analysis of the Commission's special access data collection shows that revenues from such TDM services continue to make up in the range of sixty percent of the roughly $40 billion annual special access market."
This new data (which we were blocked from examining in detail) shows the special access market has doubled in size since the FCC's guesstimate in 2013, when common wisdom was that this market was only $12-$18 billion. This means that the wired networks are growing, and that the copper-wired-networks had massive increases in lines overall, contradicting all of the noise about 'dropped' lines.
How Many Special Access Lines are there? "Zero"?
Unfortunately, the FCC has revealed "0" Special Access Lines; that's "Zero". There is no mention in any document we can find that supplies the basic special access line accounting. But, based on the number of access lines in 2007 and the growth in revenues discussed, there could now be as many as 600 million related access lines.
Why does this matter?
To repeat, Verizon announced its plans to shut off the copper wires, claiming that everyone has been dropping the lines. Therefore, Verizon says these wires should not be maintained but simply shut off. In some areas, the copper wires will be replaced with fiber optics. But a number are lines used by competitors, and customers may lose their competitive provider. In more rural areas, the plan is to force customers onto more expensive wireless... or just not care about their service and let the copper deteriorate because - well, no one is using the wires, right?
And it matters because there are multiple FCC and state proceedings where the companies and their associations have used the 'conventional wisdom' that everyone is 'dropping their landlines' as an excuse to not only 'migrate' customers to wireless or fiber, but to also kill off the competitors, or not be required to even offer service or maintain the utility infrastructure.
The Lines are Hiding in Plain Sight, Almost.
This is the panoramic 'before' picture. Ever noticed the 'cell sites' or counted the wires on poles or did know that the conduits under the streets are filled with wires?
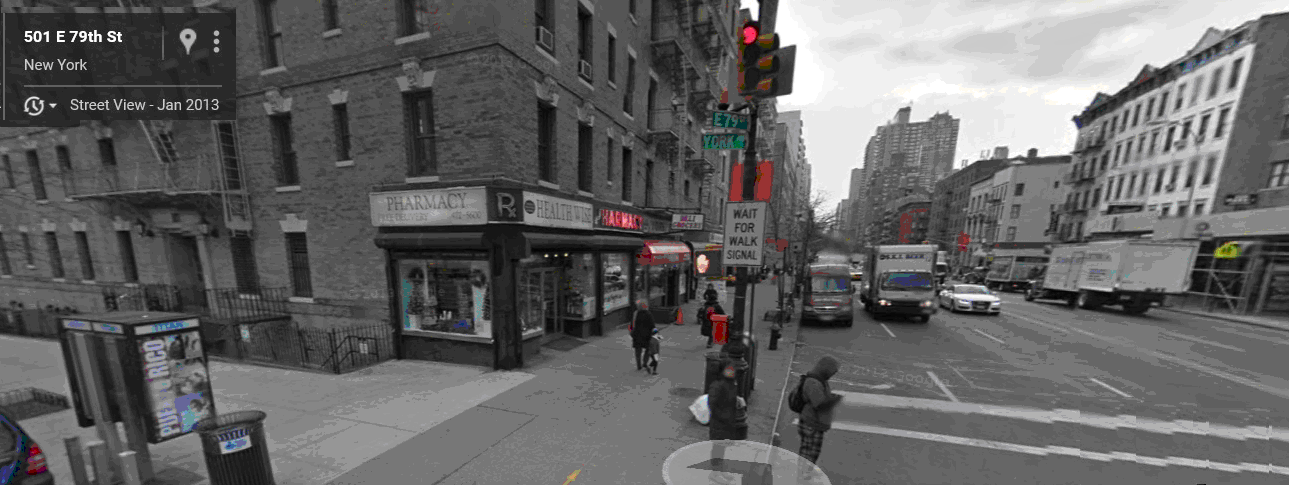
We chose E79th Street because Verizon has announced it is planning on 'shutting off the copper wires' in the neighborhood.
If you look at the first highlighted picture you see that 'special access' lines, from bank ATM lines, or the wires to the cell sites, are not counted; a DSL line is not counted, the wires running up and down the streets known as 'back haul' aren't counted, FiOS isn't counted - just basic local phone service, and it is marked here in white.
That likely means that $24 billion dollars of mostly copper wires across the US were NOT counted as an access line.
How many lines are we talking about? Let's do this by the numbers.
1) FCC "Total Access Lines" in Service in the US in 2007 -- 424 Million.
Let's start with 2007, the last date the FCC published 'access line accounting' in America. And I'll use the excerpts from the exact FCC data being mentioned.
This chart is from the last FCC "Statistics of Common Carriers" in 2007. It shows that there was a total of 424 million access lines in service in America, (but with caveats), and 379 million belonged to the "Regional Bell Operating Companies", "RBOCs", who are now AT&T, Verizon and CenturyLink, (with various caveats as Verizon, for example, has been selling off properties such as the sale of New England Telephone's Maine, New Hampshire and Vermont to FairPoint).
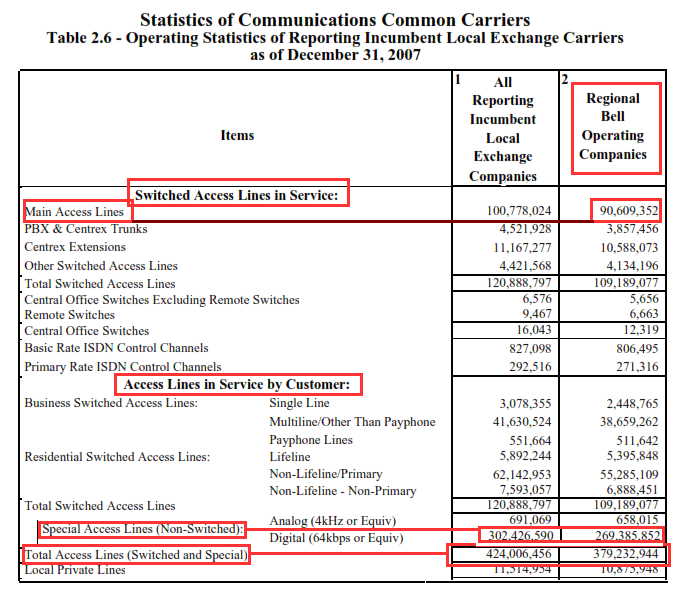
At the top of this chart are 'Main Access Lines', showing 91 million RBOC lines in the US. These are the phone lines, the basic 'land line', as some call it. Thus, at that time, basic phone lines were only a ¼ of the total lines.
And here is a link to the FCC's 2007 data of total access lines by state.
Also, please notice that there are a host of different types of lines: 'switched access' lines and 'non-switched' access lines, as well as payphones or private lines or other business services known as 'Centrex'. What is shown on this chart are mostly copper wires that are mostly part of the state utility.
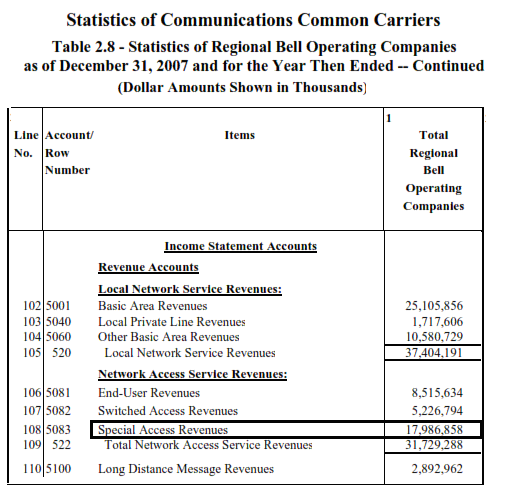
2) AT&T, Verizon, CenturyLink Revenues for Special Access Lines, 2007
This chart is based on the same FCC 2007 report, showing that the copper-based special access services represented about $18 billion for just AT&T, Verizon and CenturyLink.
3) Revenues and Lines, 2007:
Thus, in 2007, for just these three companies, AT&T, Verizon and CenturyLink had about $18 billion in special access revenues and based on the previous chart, this represented approximately 269 million total special access lines and a total of 379 million lines, which included basic phone lines.
NOTE: This revenue and line accounting is only based on the three companies. The 'total lines' includes all of the other incumbent phone companies.
4) 2013-2015: The Current, Amazing, Slight-of-Hand Trick. Zero Lines but $40 Billion in Revenues.
The FCC's current analysis has not mentioned actual lines in service -- '0' lines-- for $40 billion of special access services, even though the majority are mostly the copper wires, which represents about $24 billion.
Extrapolating the number of lines based on the lines associated with the 2007 special access revenues of AT&T et al., we found that the $24 billion could represent 350 million copper-based access lines, not in the current 'access line' accounting; $40 billion could be almost 600 million access lines. 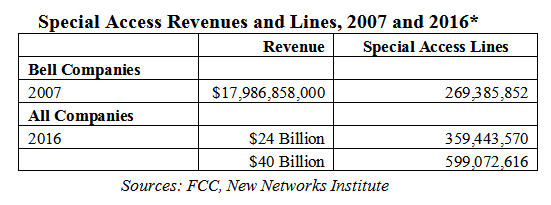
5) *Caveats to the Manipulation of the Accounting.
- There is no accounting, by any government agency, of the number of actual copper lines in service or the number of 'equivalent lines', etc.
- The FCC's new info is for the year 2013.
- These numbers are rounded and probably off by who knows how much.
- It is not inclusive of all revenues because the FCC only collected data from end users, not the telcos themselves.
- In 2007, the Bell companies represented 90% of all telecommunications lines and revenues.
- These new numbers may or may not include the cable companies' special access services.
- Special Access is mostly a regular phone line, yet the accounting has been 'manipulated' to count the actual, physical line based on its 'use'.
- DSL, for example, has historically been classified as a 'special access' line.
- AT&T's U-Verse with VOIP, changes the classification of the copper wire that could have been in service for 50 years.
- NOTE: The access line accounting does not account for the cable companies' wires.
6) Access Line Equivalent Accounting.
As we discussed elsewhere, the access line accounting represents both a physical wire as well as 'equivalent' lines (or sometimes called 'virtual' lines). Two examples:
- DSL: A phone line with a DSL line can have 1 copper wire but two services over the wire-- phone service and broadband/Internet service.
- Business T1 line or DS1 line can have 24 simultaneous calls over 1 wire (or a few combined wires).
This accounting goes both ways. Customers bought second lines for 'Internet' and 'dial-up', but it wasn't needed with DSL because 1 physical wire could handle voice calling and broadband/Internet - so customers dropped second lines. Or, when a company went to a "T1" line it replaced 24 separate copper wires, both lowering the accounting supplied by the telcos.
7) State Model: Access Line Accounting Manipulation Using Verizon New York.
These access lines numbers are provided by Verizon New York as quoted by the phone industry association and lobby -- the United States Telecommunications Association, USTelecom, "USTA". It claims that Verizon New York only had 2.9 million access lines in 2015, down from 11 million in 2000.
USTA cites Verizon New York's Access Line Accounting, 2015
"When you look at the numbers in New York, in 2000, the incumbent (Verizon New York) had over 11 million access lines. Today they have 2.9 million access lines."
That is actually a small subset of the total actual, physical wires in service.
8) Verizon New York: 47 Million Lines in 2007.
This next exhibit is from the FCC's "Statistic of Common Carriers" report for the year 2007. Verizon NY had a total of 46.8 million access lines in 2007. The access lines USTA cites could fall under the 4.7 million "Main Access Lines" (or it could include some of the other 'switched access' categories), but it is mostly the voice, "switched", copper-based phone lines, which constitute only a fraction of the actual lines in service in the year 2007.

9) Verizon NY Special Access Revenues $1.8 Billion; 63 Million Access Lines?
We have something the FCC didn't bother to examine -- Verizon New York's actual special access revenues, by year. Special Access revenue, in just 'copper-based', telecommunications revenues, went up over 58% since 2007.
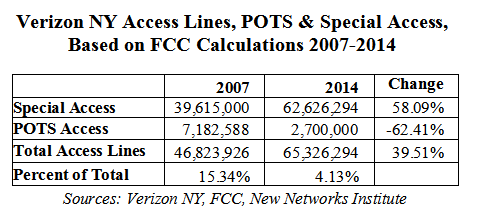
- In 2014, there were approximately 62.6 million 'special access' lines and 'equivalents' in NY State; adding the POTS lines brings the total to 65.3 million.
- According to Verizon, there were only 2.7 million POTS access lines; about 4% of total lines, in 2014. (This differs somewhat from the USTA statement and is sourced from Verizon NY Annual report.)
- Special Access line accounting is not included in the access line accounting supplied by Verizon, or any telephone company.
And based on actual revenues for 2007-2014, there could be 63 million total special access lines and equivalents in service in New York today. And these would be mostly copper based, as this revenue bucket is part of the state utility accounting.
There are other buckets of special access not counted. (Thus, these findings would fit into the FCC's $24 billion 'mostly copper-based' analysis and is missing the other 40% representing the total of $40 billion.)
10) Disconnecting Customers Based on Cooked Accounting?
This is an excerpt from a Verizon New York City disconnection notice (click for the full notice) that triggered this article. It says that if a subscriber is using copper- based services, which include "DS1 data services", or "ISDN" services or the customer uses a competitor, then these services in New York City will no longer be available. Verizon will be using only fiber optics.
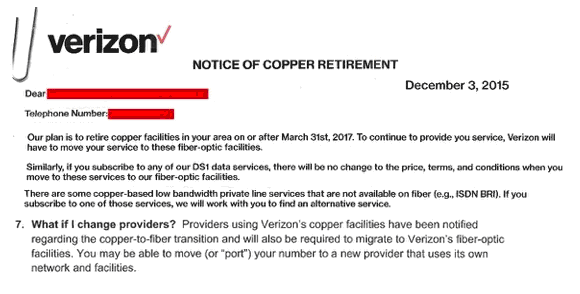
But as we just pointed out, not one of these lines -- not the business special access DS1 service, not the ISDN, not the 'competitors who use the copper wires', is included in the access line accounting supplied by Verizon or the FCC.
And the FCC and states are allowing the companies to 'migrate' customers based on Verizon's made-up access line accounting.
11) The Con: Shut Off the Wires by Creating a Shell Game With the Accounting.
We also filed a letter for investigation of the data and analysis used in the recent FCC decision known as USTA Petition Forbearance. In that decision the FCC actually wrote:
"We noted that 44 percent of households were "wireless-only" during January-June of 2014. That number increased to 45.4 percent by the end of December 2014, such that more than two in every five households did not have a landline telephone. We have stated that, overall, almost 75 percent of U.S. residential customers (approximately 88 million households) no longer receive telephone service over traditional copper facilities.
"Similarly, USTelecom asserts in its Petition that barely one-quarter of U.S. households rely on traditional switched service from an incumbent LEC. We further note that, according to our most recent data, 53.5 percent of connections to businesses are currently provisioned over incumbent LEC switched facilities."
Simply put, none of this is based on actual accounting of lines in service but on 'subsets' of data. The ;wireless-only; household data doesn't include 'lines'; it is only about 'voice calling', while the '53.5%' of businesses uses the word 'switched' as if the copper wire somehow changes depending on the type of traffic carried over the wire.
The FCC found $24 billion in 'mostly copper wires' but none of these lines are in this 53.5 percent statistic. How can the FCC can use this make-believe accounting is beyond comprehension.
In the Verizon NY disconnection notice, the 'DS1' that may be shut off is NOT 'switched' and therefore is not counted as a line - yet, since there is no rational accounting of copper access lines in service, much less fiber optics, the regulators and FCC can play games to claim there is a 'loss' of lines and revenues. In fact, it is nothing more than an accounting shell game, set up by AT&T et al., now with the help of the FCC.
We just want to know the answers to few basic, simple questions:
- How many total copper and fiber access lines are in use today?
- How many lines does the $24 billion in Special Access revenues (from mostly copper based lines) represent?
- How many lines are represented in the $40 billion total?