
I've been a big fan of Bennett Stewart's approach to evaluating the financial performance and health of companies for a long time, so I was delighted when his company, evaDimensions, made a free version of its Corporate Performance Index available for investors, executives, board members, academics, and anyone else who is curious to see how companies compare to their peers. After I saw a demo of the system, I asked Stewart some questions about how their metrics differ from traditional measures and what they can help us understand about value.
You are critical of TSR (total shareholder returns) as a metric for understanding companies. We'll get back to why in a moment, but first tell me what useful information TSR does provide
Let's define it first. TSR is the sum of the dividends from a stock, plus the change in the value of the stock, divided by the initial value of the stock. If a stock increases from $10 to $11, and over that time paid a $0.40 dividend, the total return is 14% -- 10% from the stock going up and 4% from the dividend yield. That tells us that, for every $100 invested at the start, the investor is now sitting on a total of $114 in value. Buying stocks that generate higher returns increases the owners' wealth, for spending, more investment, or charity if they want.
Now, how can it be misleading?
It's flawed in a number of ways that make it a misleading, and certainly incomplete way of judging how well a company is doing from a financial point of view. TSR can look very good for a weak company that has just experienced even a modest rebound from a depressed valuation. I liken it to a patient in critical care who recovered, but who is still far from fit.
On the other side you have elite firms like Apple, that have racked up such good results over such a long time frame, which has taken their valuations so high, that even a modest slip or failure to meet unrealistic expectations can show up as a poor TSR for a time. These are like mountain climbers who have ascended a summit, then taken 10 steps down, and are criticized for falling. They say, "not at all, the view is still great from up here, in fact, I can see all my competitors wallowing in the muck way below." TSR only tells us about the recent up or down movement and not the accumulated track record of a firm.
Another problem is that when a company finances its business with more debt, and less equity money, that will increase its return on the upside and crush it on the downside. Take two companies with the same performance, and the one that uses more debt will look better and generate a far higher TSR on a run up and a far lower one on a run down. You really can't fairly compare companies that vary in leverage ratios, yet those comparisons are used all the time without any adjustments.
A final point is that TSR measures the return for a shareholder who held the company's shares over the whole period, and thus it ignores what happened to shareholders who sold stock to the company over the period. They may have realized a far higher or lower price than the end of period price.
The point is, we'd like to measure the return for the shareholders, plural, as a group, but TSR only measures it for a shareholder. With so many decisions riding on a company's TSR compared to its peer group, such as judging whether managers are being overpaid, TSR needs a reality check, it needs some supporting metrics that can confirm it, or challenge it.
Same two questions for another popular metric, EPS (earnings per share). What does it tell us and what does it overlook?
EPS, earnings-per-share, is certainly the single most popular corporate performance metric (that is distinct from TSR which is a stock market return metric), but it shouldn't be. The appeal of EPS is that is shows how much profit that company is earning per share of stock. It's a shareholder's share of the profits. Its assumed that if a company reports a rising trend in EPS, that is a good sign that will lead to a higher stock price and a higher price-multiple.
But that is really not true. One of the easiest things a company can do is take its profits, pay some dividends, and plow the remainder, called retained earnings, back into investments that will grow the earnings, and as long as those investments produce any positive rate of return at all, the firm's earning will grow, even if the return the company earns is quite low and is less than what investors could otherwise expect to earn on their own.
As Warren Buffett once said, and I paraphrase, "Any idiot can increase earnings. Just put more money in a savings account and you'll get more earnings. The real question is, what is the return you are getting on your money?" EPS growth is no guarantee of a high price or price multiple because companies can buy the growth, can inflate the growth, just by pouring money into relatively low yielding investments that are less than what the shareholders could earn on their own, by investing the money in a stock and bond portfolio priced to give them a decent, competitive market return. In short, a company can grow profits per share, but reduce value per share.
Another problem with EPS is it is computed according to accounting rules that frankly miss the mark in many ways. To take just one example, book profits are computed while deducting any money spent on R&D and on brand advertising as a period expense. A company can easily hike book profits by cutting back on these long-term investments, and it can look bad if it steps up the pace of investment in innovation and customer connections.
You may ask why accountants do this. It's because, at root, accountants don't work for the shareholders. They are really working for the bankers. The creditor crowd wants to write loan covenants against the book value of tangible assets, the hard stuff they think they could liquidate to get their money back in the event of bankruptcy, and they are reluctant to lend anything against the intangible values created in the going-concern business. To accommodate the banker's preference for concreteness, accountants expense those investments; they write them off immediately, charge them to earnings, and never let them appear on the balance sheet as an asset. So this accounting practice can really distort perceptions and warp the incentives of managers where their bonuses are based on reported profits.
A third problem is that it is easy to gin up EPS by borrowing money to buy back stock, and reducing the share count. Yet, that increases earnings-per-share, but you have to keep two things in mind. One, the EPS has to go up to compensate the shareholders who keep the stock for not selling. The other guys cashed out, they have their money safely in the bank, so the increase in EPS is not a benefit; it's just to stay even. Another way to look at it is that the EPS becomes riskier, more volatile. It will jump higher on the upside, and plunge deeper on the downside, because the earnings swings are spread over fewer shares. The remaining shareholders need to be compensated for bearing that risk, and they are, by coming into the stock at a lower price-earnings multiple - which gives them a higher earnings yield if you flip the multiple on its back. CEOs commonly time share buybacks to make EPS goals, but the manipulation of EPS really does nothing to add to the firm's intrinsic value. I add, there are good reasons to buy-back stock, for example, it is better to return money to investors and let them earn a higher return investing it outside the company than could be earned inside the company--but reasons like that have nothing to do with EPS per se.
The bottom line is that EPS really should be abandoned as a measure of company performance, for all its flaws, because there is actually a far better way to measure the true economic profit a firm is earning.
You speak in terms of a company's health rather than its value? What is the difference and what does its health tell us?
Value is one-dimensional and health covers all the bases and helps to explain what is behind the valuation. Health is like going to a doctor, or better, a longevity center, and really getting a complete diagnostic panel, instead of just a heart exam, angiogram, for instance. Health is looking at multiple dimensions of corporate performance and getting a broader, more accurate, more diagnostic reading than from just a market score alone.
How is your CPI measurement most useful to managers? To board members? To investors?
CPI is that comprehensive diagnostic test I talked about. It does culminate in a single score of financial excellence, but it comes from 4 key tests of corporate health. And just as your health statistic need to be judged against your age category, handicapped if you will, to be meaningful, the CPI metrics are all graded against a company's peer group of companies operating against similar challenges and experiencing similar cycles.
I should mention that CPI is not based on EPS. It is based on another profit measure called EVA, which stands for economic value added, that repairs EPS flaws and comes much closer to measuring true economic profit. The chief difference is that under EVA, a company's profits are assessed a return on equity charge. EVA sets aside the profit that must be earned to provide shareholders with a minimum market competitive return on their investment in the company, including the retained earnings. All of a sudden many companies that look EPS healthy show up as EVA weaklings - if they are not deploying capital wisely or effectively to generate acceptable returns. Also, with EVA we write off R&D and advertising spending over time, instead of expensing it. Now companies can't look good by making cuts, or look bad because they investing more in their future. EVA also bases the equity charge on the amount of equity the firm would have at a running target blend of debt and equity to finance its business. While EPS can be goosed up with a debt-financed stock buy-back, that doesn't really help EVA unless the company maintains a higher leverage ratio, as a strategic way to reduce its overall funding costs. Put it all together, and EVA is simply a much better, broader, more comparable measure of a firm's true profit performance than the reported profit figures.
For CPI we look at how fast the firm's EVA profits have been growing over the past 3 years, and the current level of EVA profits, relative to sales, as a profit margin. So the more a firm is earning and increasing EVA, compared to peers, the higher its CPI score will be.
We also look at two market metrics. One, called MVA, for market value added, looks at the spread between the firm's overall valuation, and the amount of capital that investors have funneled into the firm to buy business assets. It's the spread between money in and value out. It gauges how much wealth a company has created for its owners. It also measures the firm's franchise value - the value of the business as a business and above and beyond just putting its assets in a pile. In other words, it's the market valuation of all the intangibles, of all the product lines, and distribution channels, and customer connections, and logistics and supply chain prowess, research and innovation, brand value, and the quality of management and corporate governance - all the really important assets. We look at the ratio of MVA to sales to tell us how much real franchise value and owner wealth a company is deriving per unit of revenues.
The last measure is derived from the stock price. It is how much EVA growth is baked into the firm's price. The idea is that if EVA is zero, and the company is only earnings its cost of capital, then it should trade close to book capital, and show really no MVA. But as EVA turns positive, and better, as it is forecast to grow, it is that expectation that leads investors to pay a larger and larger MVA premium. There's a numbing math formula connecting the firm's projected EVA to its MVA, but with it, we can work backwards from MVA and determine how much EVA growth, or shrinkage, is baked in. Right now, IBM's share price and MVA are telling us that investors foresee a continued decline in EVA profits for some time to come. That's obviously not a good sign, and it reduces a firm's CPI score.
So in sum, the firms that score highest are those that are generating the greatest growth trend in EVA profits, that are presiding over valuable and profitable business franchises, and which are strategically best positioned to generate sustained growth in EVA profits, as far as investors can tell, relative to industry peers.
Where CPI helps is that about 60% of the time, a company's CPI score is fairly strongly correlated to the TSR it generated over the past three to five years. In those cases, CPI tends to confirm TSR, giving it added weight and credibility. The underlying CPI metrics also help to explain the factors that are actually determining TSR. A problem with TSR, even if you like the measure, is that it is opaque. TSR itself says nothing about what determined the TSR or how managers could work to improve it. Where CPI, and especially, the underlying EVA metrics help, is to explain why TSR is TSR, that it fundamentally is a function of earning and increasing EVA profits, and giving investors more confidence that EVA can continue to grow.
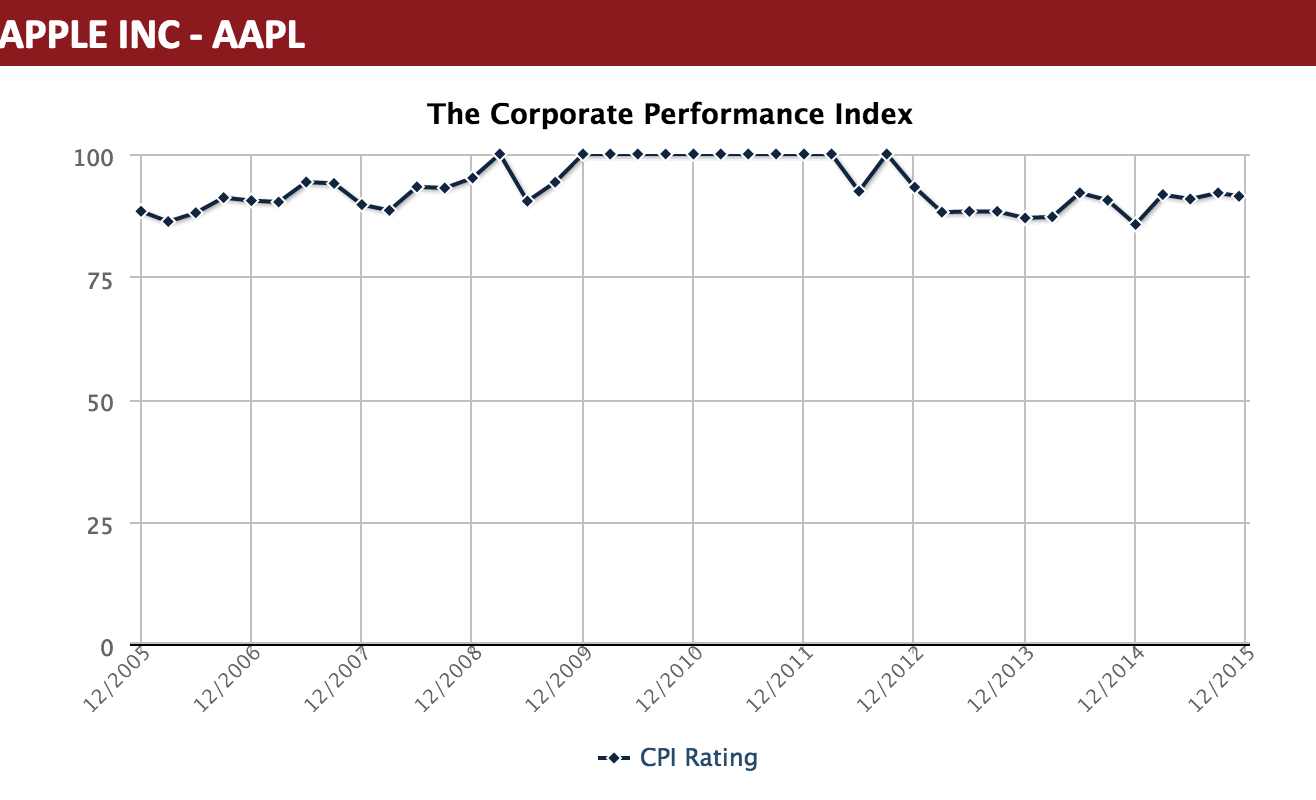
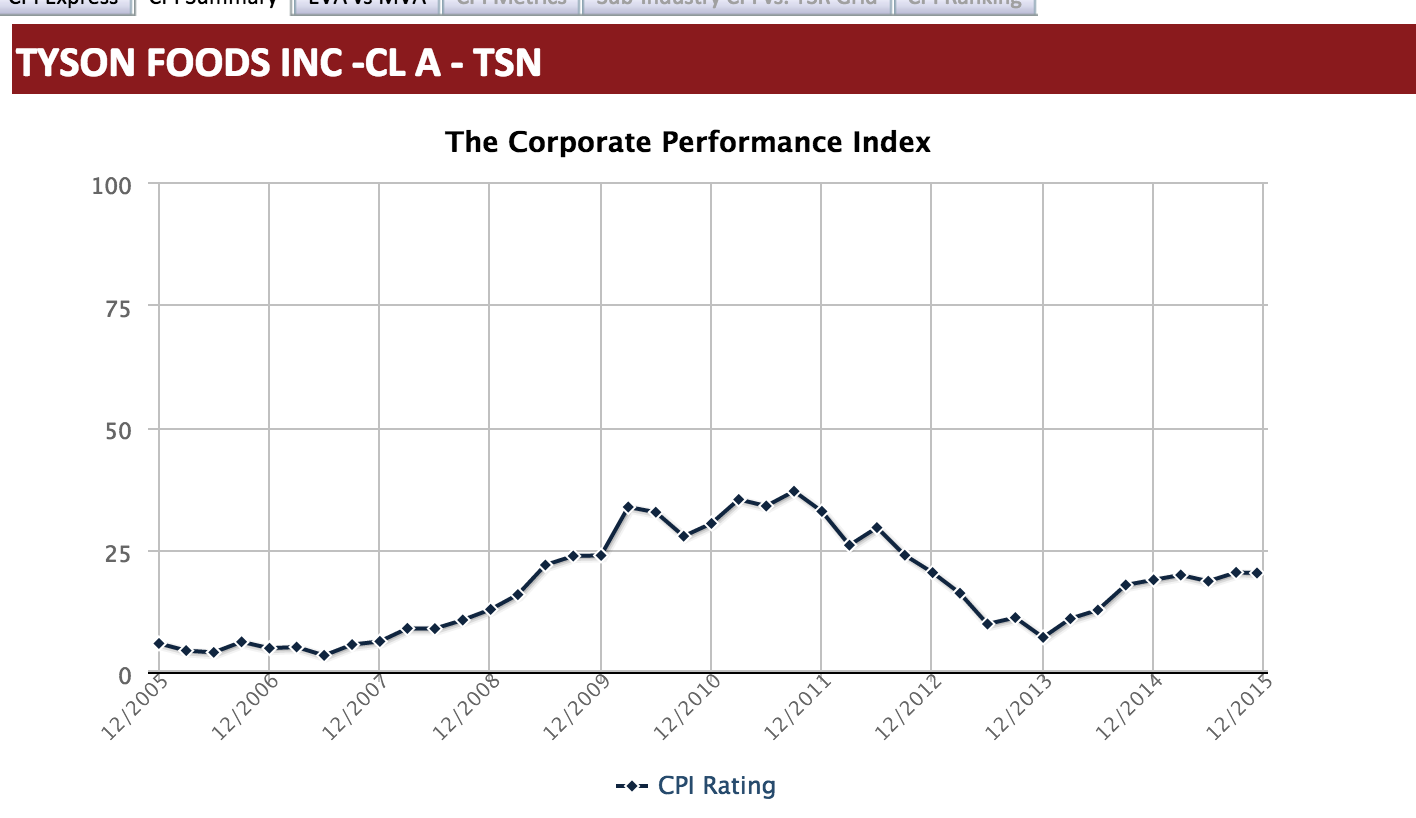
On the other hand, about 40% of the time CPI can give a very difference score than TSR, and in those cases, far more often than not, CPI is the more accurate grade. A simple example is that right now, Apple is rated 91 out of 100 by CPI. EVA, and CPI, see a highly valuable, profitable, growing, innovation enterprise, worthy of emulation. Apple's TSR over the past 3 years is just at the 48th percentile among tech firms. According to TSR, Apple is a middle roader. That's a 43-point spread between CPI and TSR. There are many others with wider gaps, and in both directions. Tyson Foods, for instance, has a 3-year TSR near the 90th percentile among food stocks - but that's only because it recovered from a near death experience. Its CPI score is 15. Unlike TSR, CPI says that Tyson is far from out of the woods, is skating on thin ice, and deserves the attention of the governance and activist community.
Companies can use CPI to help them understand and better manage TSR. They can use it to offer a credible counterpoint to TSR when it's higher and help defuse concerns that pay is out of whack with performance. Boards, too, should watch it to understand whether their company is still vulnerable despite a seemingly favorable TSR. CPI also offers a structured way for any board or management team to take stock of how the company is performing, how it is valued, and how it is positioned, relative to peers. It's a radar screen to give a bird's eye view and keep the board dialogue focused on the metrics that matter.
Activists can use it to avoid hounding the wrong companies, and spot those that need a kick in the pants, or close watching, despite a seemingly favorable return, and for those firms that really need hounding, they can use CPI to make the case in a more understandable and credible way.
It's time to move into a new phase of corporate governance. Right now it's been reduced to a simplistic judgment of TSR. Boards are responding by tying pay to TSR, not realizing its flaws, and, without taking into account that TSR is an impractical metric for motivating managers and equipping them with tools and decision techniques that will actually enable them to make better decisions and create more value. CPI, and EVA, are a better solution.
Are there accounting measures you consider especially misleading?
Well, EPS certainly as noted. But really, all of them are flawed. A measure like EBITDA (earnings before interest, taxes, depreciation, and amortization), which is a favorite of the private equity crowd, is especially bad because there is no charge for tax, there's none to cover the depreciation on assets as they wear out and need to be replaced, and there is no recognition that lenders and shareholders demand a return on the capital they invested. It's a fairy tale metric that can lead to very bad capital allocation decisions. The private equity guys will say they control the capital by sitting on the boards, well fine, but if that is the case, they still ought to use EVA anyway because it actually is far better correlated to the share values they say they are trying to maximize.
Funny enough, I am also not a fan of profit margin or return on capital type measures. Many times a company passes by valuable growth and investments just to maintain high margins or ROI (return on investment). They behave like basketball players judged by shooting percentages. They want to take only the sure lay-up, stand in the corner, and say "don't pass me the ball, I cannot improve on 100%."
Harvard professor Clay Christensen popularized the notion of the innovator's dilemma, the tendency of large established companies to be overrun by upstarts. Those big firms become so enamored with maintaining pristine margins and high ROIs they pass by the pockets of opportunity the upstarts used to wedge into the business. I agree with his diagnosis, I have seen it myself, but I also believe the EVA is the antidote. It helps cure the dilemma because it takes R&D and ad spending to get new stuff into the market and treats it correctly as investments. Also, EVA goes up with any return over the cost of capital, even if less than what that company or division currently has. EVA is always value additive. If you add something good enough to something great, EVA is always greater still, but that is not true of margin or ROI metrics. EVA is pro-profitable growth and those just aren't.