National health rankings published by County Health Rankings & Roadmaps reveals a detailed analysis on the healthiest and unhealthiest counties in Illinois for 2015. The counties are ranked according to a set of factors including length of life, quality of life, personal health behaviors, physical environment, access to clinical care and socioeconomic indicators.
Below is a graphic showing the weight of each category:
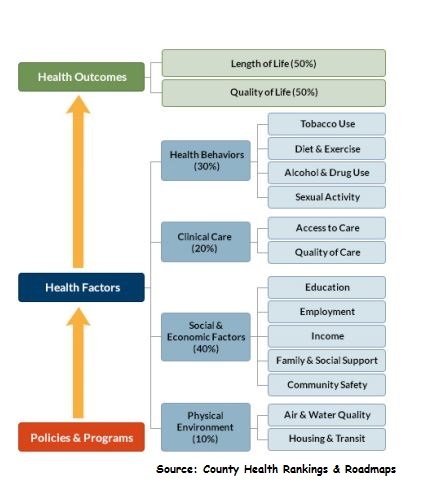
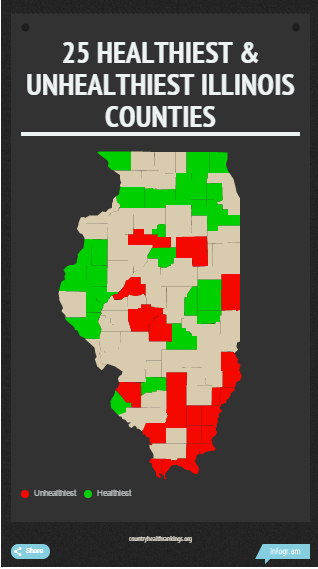
There are 102 Illinois counties, and the map below includes the 25 healthiest and the 25 least healthy in each category. For each county, there is a set of statistics providing a more detailed glimpse into the county's health. These statistics can be viewed by visiting
:
- Percent of adults reporting poor or fair health (age-adjusted).
- Percent of adult population reporting a body mass index (BMI) equal to or greater than 30.
- Excessive drinking (binge plus heavy drinking).
- Physical inactivity (number of adults aged 20 or over that report having no leisure-time to partake in physical activity).
- Uninsured (percent of population under the age of 65 without health insurance).
- Percent of 9th graders who graduate high school in four years.
- Percent of children living in a single-parent household.
- Violent crime rate per a population of 100,000.
- Air pollution (average daily measure of fine particulate matter in micrograms per cubic meter - PM2.5).
You can read more on the
. To view all of Illinois' counties as well as additional metrics, check out County Health Rankings & Roadmaps'
To see a detailed list of all 25 unhealthiest and 25 healthiest Illinois counties, including adult obesity rates and high school graduation rates for each county listed, check out Reboot Illinois.
Advertisement
[RECOMMENDED]
- Top 25 Illinois counties with the highest and lowest median income; college-educated residents
- 10 Alarming Facts about the Heroin Epidemic in Illinois
- Top Illinois Counties with the Most Meth Lab Busts
- Top 10 Worst Tornado Disasters in Illinois
- Want to tell your elected officials what you think of the state of government in Illinois? Use our Sound Off tool!
Sign up for our daily email to stay up to date with Illinois politics.