
The White House recently revealed a great new website to research colleges using aggregate data collected on colleges by both the Department of Education and the Treasury. The original goal for this site was to provide an explicit ranking system of colleges based on factors such as graduation rates and post graduation earnings - intense pushback from colleges stymied this goal but excitingly all the data is available for download so that we can try our hand at a ranking ourselves!
In particular, it would be very useful for prospective students to know which colleges offer the most bang for their buck, and a good approximation for this goal is to rank colleges by the ratio of student earnings after graduation to their debt at graduation.
Student Earnings to Student Debt Ratio
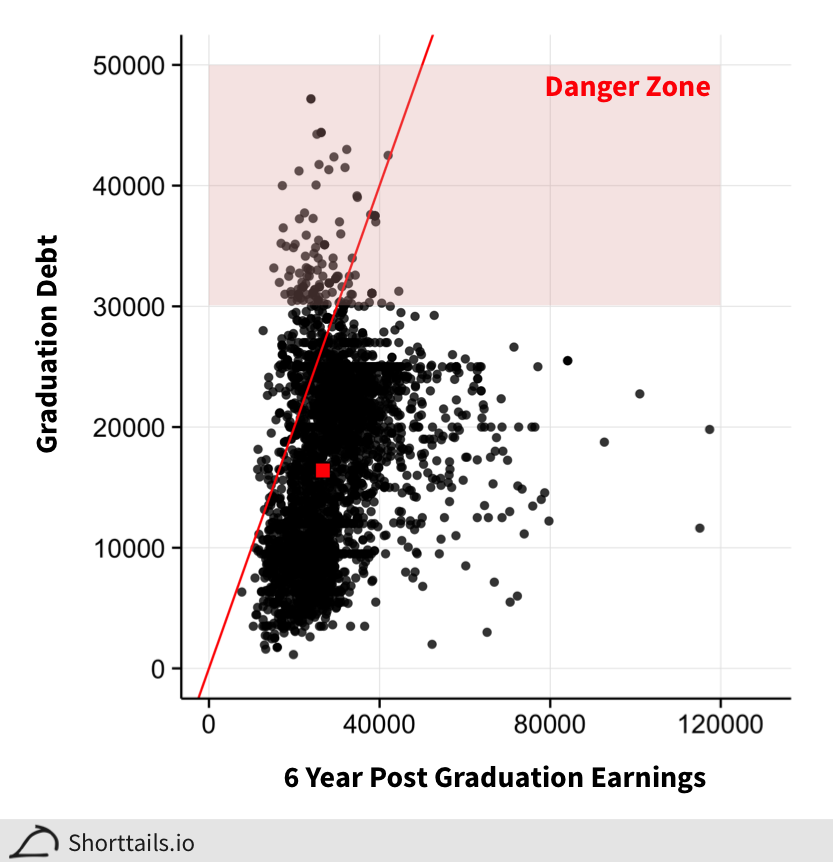
Above is a plot of the aggregated median earnings of students six years after graduation at each of the 4,284 colleges in this data set versus the aggregated median student debt at graduation (1). The red line indicates the point at which the yearly income matches the graduation year debt. The red square is the median earnings ($26,700) and median debt ($16,404).
Overall there is a strong spearman correlation of 0.48 between earnings and debt; interestingly though, there seems to be a decisive point around $30,000 where taking on more debt no longer results in increased earnings at all and in fact results in slightly decreased earnings.
Taking the ratio of these two axes (earnings and debt) we can then rank all the colleges by their earnings to debt ratio (a college's return on investment). Institutions with a higher ratio have more "bang per buck":
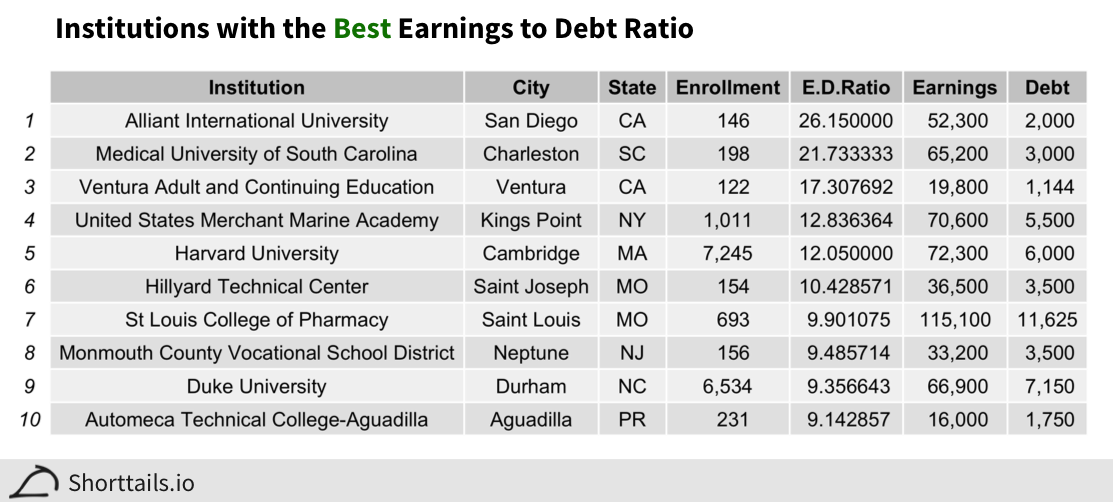
A full searchable ranking is available here. As with any analysis, there are many qualifications that apply to our result, such as the fact that these results do not include any students in graduate school six years after graduation and groups traditional colleges with vocational and primarily graduate education institutions (2). Also, you may notice that some of the schools with a high earnings to debt ratio do not have a very high absolute earnings score (instead they have very low debt), filtering these scores for only colleges with earnings above, for example, $40,000 yields a list much more similar to US News' with many Ivy League Universities at the top spots.
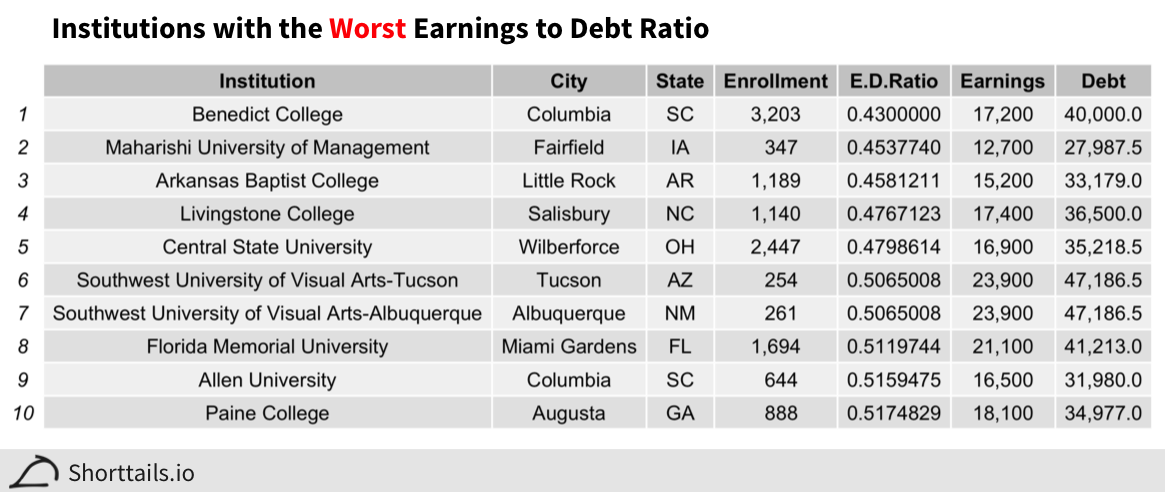
We can also take a look at the worst return on investment colleges:
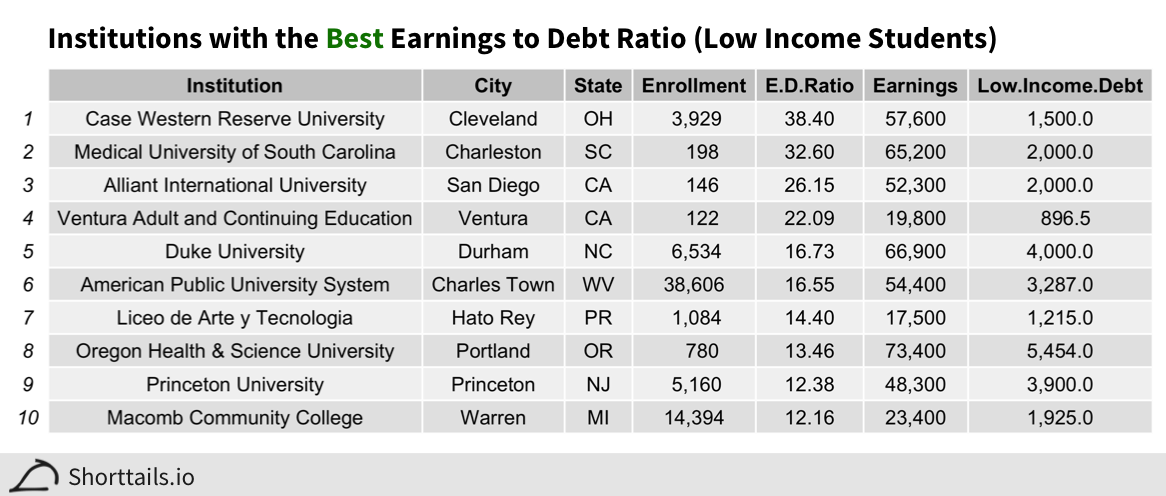
Another point to note is that it's possible some colleges simply have high income families enrolling their children, resulting in a low debt load (and also potentially explaining the high post graduation incomes). To control for this possibility we can do the same analysis as above but with only the debt taken on by students from families with less than $30,000 of income:
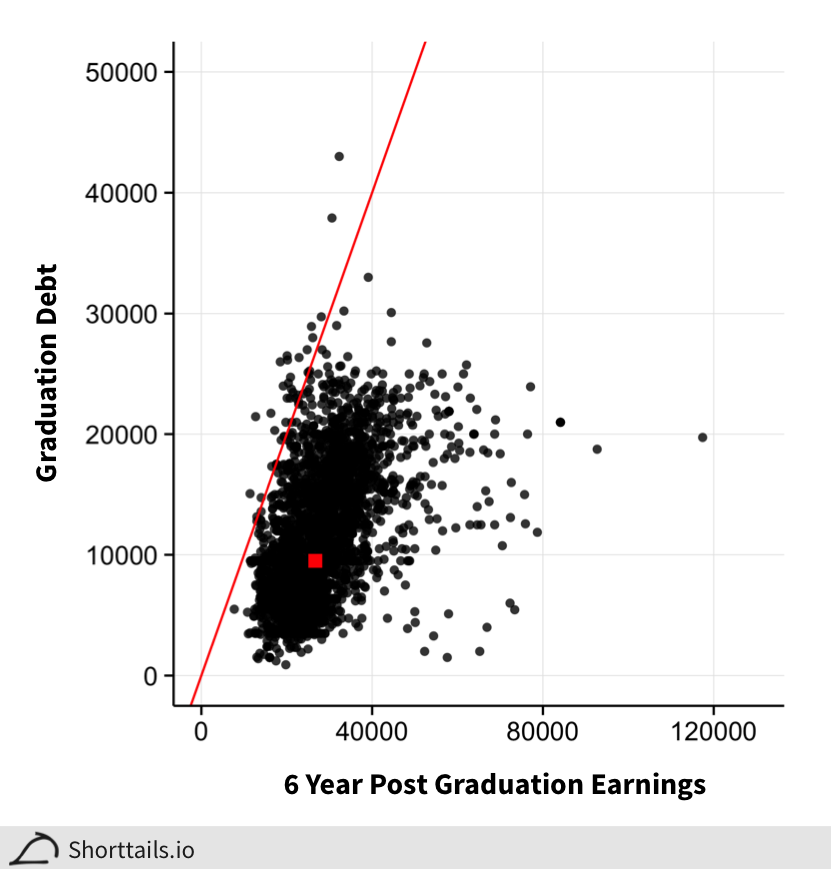
Strikingly, but perhaps not surprisingly, we see that low income family students take on qualitatively less debt than students in general. In particular though, the amount of debt taken on caps before reaching the danger zone that we saw in the overall scatterplot.
The top return on investment colleges using this data are similar to before (spearman correlation of 0.76) but there are some colleges with major gains like Case Western Reserve and Princeton University (full searchable list available here):
Do Selective Admissions Correlate with Better Financial Returns?
Another interesting question is if the admission rate or academic competitiveness of a school has any correlation with the earnings to debt ratio (3): e.g. do schools with higher admission standards have a higher return on investment? To examine this question we can look at the scatterplot of average SAT scores and admission rates versus the earnings to debt ratio we calculated above (again, a higher ratio is better value):
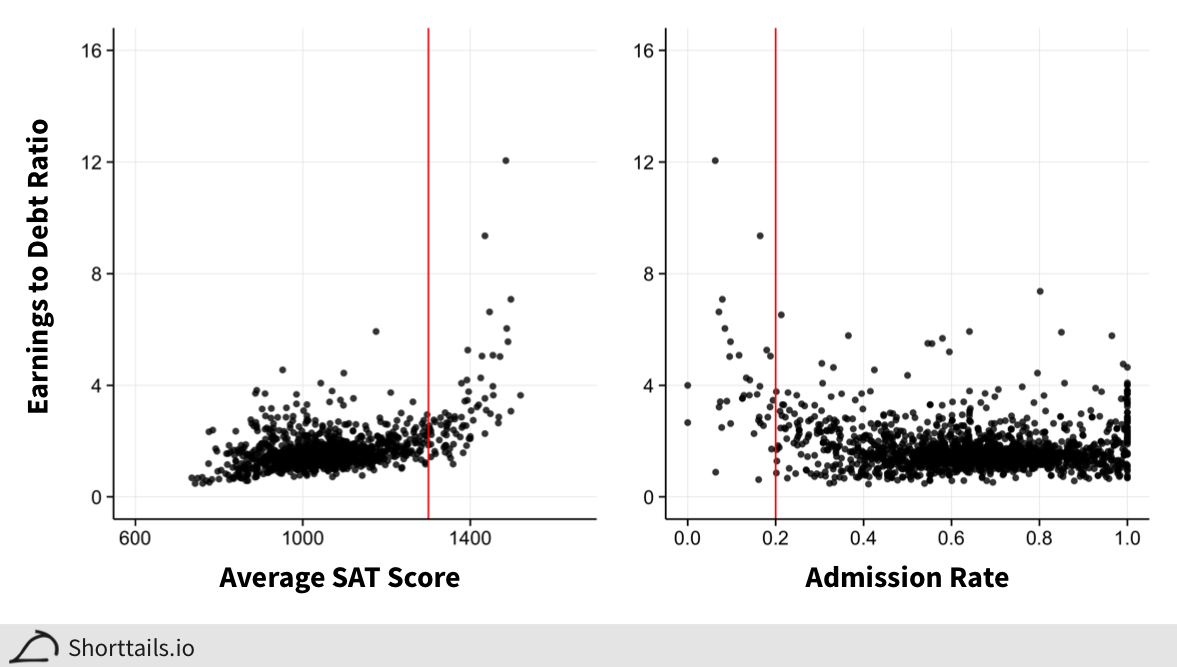
As you can see in the plot above there is very little correlation between more selective admissions and college ROI until relatively high admissions standards (red lines are at 1300 SAT and 20% admission rate) where there suddenly develops a much stronger correlation. These data suggest that there could be a large difference generally in the cost effectiveness of college for students that go to relatively selective versus non-selective institutions.
Overall it's important to remember that in general college is a good financial choice, so this analysis is sorting out how a generally good choice can be made even better. Perhaps the most surprising and applicable findings here are how there is both a distinct cutoff for when taking on more debt stops yielding earnings returns and also what level of academic selectiveness really matters for having access to colleges that belong on any "best buy" list.
---
Have more ideas or suggestions about how to use this data? Drop a line at suggest@shorttails.io! Or contact me on twitter: @martintrevor_
You can also sign up for notifications of new posts here.
---
1: These data are based on Title IV loans and the most recent six year earnings data available - the 2011 earnings for the 2005-2006 graduating class.
2: If a college has many students that further pursue their education and then receive high salaries after post-baccalaureate studies they are not counted in this metric.
3: The spearman correlations between earnings and average SAT score and admissions rate are 0.48 and -0.15 respectively.