
This week the Intergovernmental Panel on Climate Change (IPCC) will release the first of three reports that constitute their Fifth Assessment on climate change. This first report, The Physical Science Basis, will cover a huge range of topics from the carbon cycle to extreme weather. But climate prediction also relies heavily on mathematics. Math defines the problem, which we study using computer models. It is also used to quantify uncertainties and to improve predictions.
The role of math is illustrated by a remarkable video of our ever-changing weather. Last month the National Oceanic and Atmospheric Administration (NOAA) decommissioned Geostationary Operational Environmental Satellite 12 (GOES-12), which monitored our weather for the past 10 years from its remote vantage point 36,000 kilometers above the Americas.
GOES-12 has seen it all: from wildfires, volcanic ash, and landscape parched by drought, to Hurricanes Ike, Katrina and Sandy, and the blizzards that gripped the central United States in the winter of 2009-10. NOAA created this video -- 187 seconds, 3641 images -- one snapshot from each day of its operational life, which amounts to 10 years' weather flashing before our eyes in just over 3 minutes. It's dramatic and amazing:
In Scientific American, Evelyn Lamb commented on how the video highlights "a tension between the unpredictability of the weather and its repetitiveness". Even after a few seconds it becomes clear that the patterns revealed by clouds differ from one part of the globe to another. Great towering cumulonimbus bubble up and unleash thunderstorms in tropical regions every day, while in more temperate mid-latitudes, the ubiquitous low pressure systems whirl across the Atlantic carrying their warm and cold fronts to Europe. The occasional hurricane, spawned in the tropics, careers towards the United States (Hurricane Sandy can be seen at about 2'50''). But the mayhem is orchestrated: the cyclones almost seem like a train of ripples or waves, following preferred tracks, and the towering storms are confined largely to the tropics.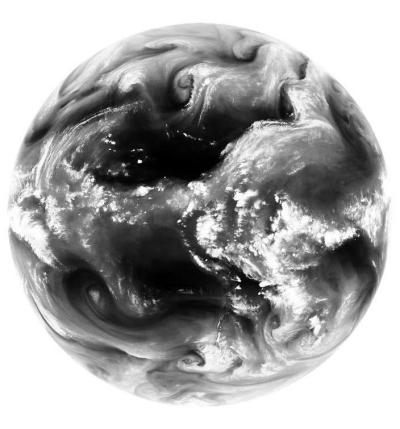
Water vapor in the atmosphere reveals the swirling cyclones and the tropical storms. While the detail varies from hour to hour and from day to day, there are recuring patterns. Image (GOES-13) courtesy of NEODAAS/University of Dundee.
In fact, this movie is affording us a glimpse of a remarkable world -- it is a roller-coaster ride on the "weather attractor".
An "attractor" is a mathematician's way of representing recurring behavior in complex systems, such as our atmosphere. A familiar illustration of an attractor can be seen in the figure below, and it is named after one of the fathers of chaos, Edward Lorenz.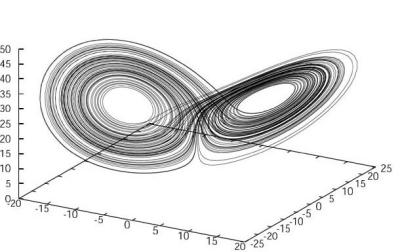
The Lorenz attractor: every point within the space delineated by the coordinate axes represents a possible state of a circulating fluid, defined by the ascent of warm air, and the temperature difference of the warmer rising air to the cooler descending air. The points on the 'butterfly wings' are the attractor: they represent the set of states around which the system will evolve. Even if the system begins from a state that does not lie on the attractor, it tends towards the states that do. The transition from one wing of the attractor to the other (which might represent a change in the 'weather') can be difficult to predict, due to inherent chaos in the system. But the overall pattern captures the repetitiveness.
It is impossible to illustrate the weather attractor for the atmosphere in terms of a simple three-dimensional image: Lorenz's very simple model of a circulating cell had only three variables. Our modern computer models used in climate prediction have around 100 million variables, so the attractor resides in a space we cannot even begin to visualise. And this is why the movie created by NOAA is so valuable: it gives us a vivid impression of the repetitiveness emerging from otherwise complex, chaotic behavior.
Weather forecasters try to predict how our atmosphere evolves and how it moves around the attractor -- a hugely difficult task that requires us to explore many possible outcomes (called an ensemble of forecasts) when trying to estimate the weather several days ahead. But climate scientists are faced with a very different problem: instead of trying to figure out which point on the 100 million-dimensional attractor represents the weather 100 years from now, they are trying to figure out whether the shape of the attractor is changing. In other words, are the butterfly wings 'folding' as the average weather changes? This is a mathematician's way of quantifying climate change.
If 100 years from now, when a distant successor of GOES-12 is retired, our descendants create a movie of this future weather, will they see the same patterns of recuring behavior, or will there be more hurricanes? Will the waves of cyclones follow different tracks? And will tropical storms be more intense? Math enables us to "capture the pattern" even though chaos stops us from saying exactly what will happen, and to answer these questions we have to calculate how the weather attractor is changing.
For further insights into the math behind weather and climate prediction, see our new book Invisible in the Storm: the role of mathematics in understanding weather.