
What parent, busily trying to make sense out jumpy data, hasn't yelled that down to the basement, especially during summer, when the kids are home from school?
My kids, however, schooled in the volatility of high-frequency data, yell back: "Dad, if you want to filter out the noise, compute year-over-year changes!"
Ah, from the mouths of babes...
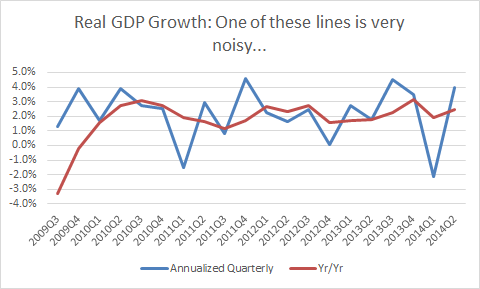
They're right, of course, and this is especially important when you're dealing with outliers like the big negative print for Q1 of this year: -2.1 percent (as revised). The figure below plots quarterly annual growth rates against year-over-year rates for real GDP over the recovery. The annualized quarterly growth rate for Q2-the one getting all the headlines-was 4 percent; the more-indicative-of-actual-trend-year-over-year rate was 2.4 percent.
I see two clear points: first, the annual changes provide a much more reliable view of the underlying growth rate, and second, since the yearly rates turned positive in 2010Q1, we've been growing at trend, about 2.2 percent on average. That would be a fine place to be if we'd first made up the deep losses from the downturn. But what happened in this recovery is that we settled into trend growth before we bounced back and repaired the damage. That's why the job market in particular has taken so long to recover.
There are lots of reasons for that as I've discussed in many places, but fiscal drag - the premature pivot to deficit reduction - is certainly implicated, especially last year (see figure here).
Source: BEA
Same with inflation, by the way (re: smoothing out the noise). On an annualized quarterly basis, the core PCE deflator-the Fed's preferred measure-jumped from 1.2 percent in Q1 to 2 percent last quarter, an eyebrow-raising acceleration. But year-over-year, the jump was from 1.2 percent to 1.5 percent.
All's I'm saying is that when the numbers are bouncing around like they've been, stay calm and smooth out the noise.
This post originally appeared at Jared Bernstein's On The Economy blog.