
...neither of which is original, but whadyagonnadoaboutit?
First, it's pretty well understood at this point that the tick down in unemployment last month, from 7.4% to 7.3% was a function of weakness not strength: the rate fell not because more folks got jobs but because more folks left the job market. But will they come back?
This kind of question feeds into the important "structural vs. cyclical" debate among those of us monitoring these developments. Is the decline in the labor force a negative, yet temporary, side effect of the underperforming economy/job market, another casualty of the residual of the great recession and our lousy, contractionary fiscal policy? Or is it a structural decline that will persist when (if??) the cyclical weakness is finally behind us, at which point the labor force will reverse course as increased labor demand pulls folks back in?
I thought these Federal Reserve economists did a nice bit of simple, clear analysis of this question in this note from a few months back. In their figure 2, they plot the change in labor force participation (labor force as a share of the adult population) against job growth by state. If states with better job outcomes also had better labor force participation results, we'd lean toward a cyclical explanation, implying that as job growth strengthened nationally, we'd see the labor force start to grow again.
I updated their figure with a few tweaks. First, in order to avoid the retirement issue--we aging boomers are another reason for the decline in the labor force, clearly a structural development--I restricted the labor force rate to 25-54 year-olds. Second, I used annual data which are less noisy. Third, I went from the trough year to the most recent full year, 2007-2012. Finally, I took out North Dakota because it's such an outlier (over a period where the average job loss among all the other states was -2.5%, employment went up in ND by 19%, thanks to the shale boom).
Anyway, for all that, the slope of my line through the scatterplot looks a lot like theirs: a positive correlation, with a statistically significant slope of 0.19, meaning a one percent increase in jobs would be expected to increase the typical state's labor force rate by about one fifth of a percentage point. To be sure, that's not enough of an effect to explain anything like the full decline in the labor force over this period; there are many more moving parts than just state job growth.
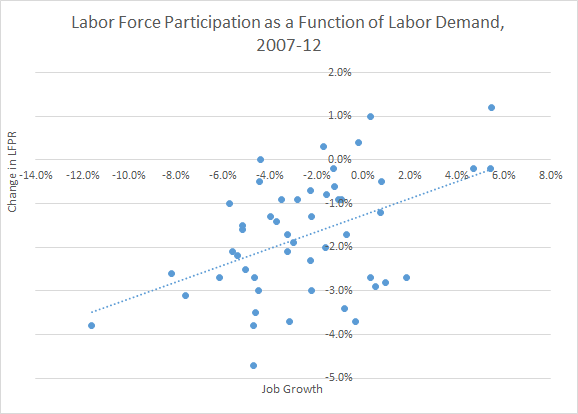
Sources: BLS CPS and Establishment surveys
But it points in the cyclical direction and in fact, if you do the same exercise for the prior five years--2002-07--i.e., over the 2000s expansion, you get a slope of only 0.03 that's statistically indistinguishable from zero. So again, uniquely and persistently weak labor demand is implicated.
Of course, there's no solid line between cyclical and structural, and with so much long-term unemployment, there's a real worry that cyclical could morph into structural, as evolving skill demands leave significant groups behind. So there's obviously a serious risk to our current policy position on these matters, which is, outside of the Federal Reserve, to do nothing to help accelerate job growth (and even the Fed's threatening to let up on the accelerator).
Did I say doing "nothing to help?" Actually, that's too kind. Recent research by Alec Phillips of Goldman Sachs Research (no link) shows that the sequester is having the predicted negative impact on employment in industries with exposure to the spending cuts, including, of course, the federal government itself (down 71,000 over the past year).
In his interesting scatter plot (the one on the left, below), Phillips plots the annualized change in job growth over the past three months against "exposure to federal spending," roughly the revenue an industry gets from the public sector. Defense/aerospace is an obvious outlier, but the negative association is fairly clear in the plot, and the figure on the right shows how the correlation between an industry's job growth and its public revenue share fell off a cliff when the sequester hit. Other exposed industries include life sciences, health insurers and providers, construction, and metals/mining (data snooping too, I'd guess, but that info's harder to come by).
As I've maintained before, I don't expect this Congress to help improve the job market and thus the living standards of working families. But could they at least do less harm?
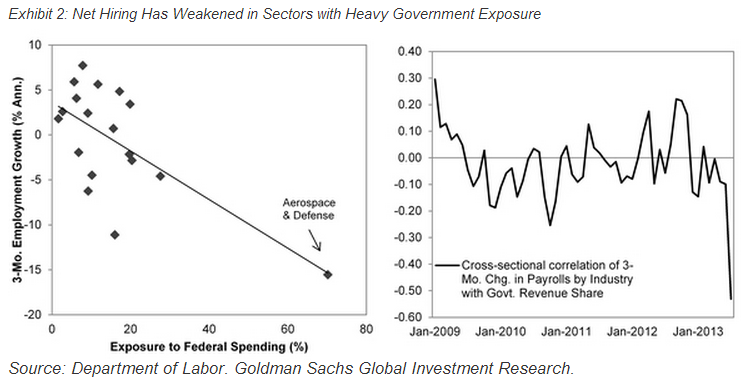
Source: Alec Phillips, GS Research
This post originally appeared at Jared Bernstein's On The Economy blog.