
Ever wonder how we decided to give Sideboob its own page?
The Huffington Post looked at a bunch of user data including Tweets, Facebook shares, article page hits, and comments. High numbers in all these categories emphasized the popularity of side boob articles amongst readers, and as quickly as possible, editors gave Sideboob its own page. Many web companies similarly turn to data to figure out what readers are interested in, but how is this data recorded and what does it look like?
In its rawest form, web data is a log of everyone's activity history that looks like this:
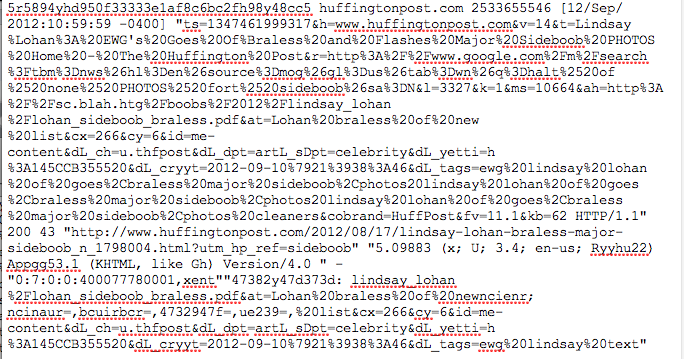
Figure 1: Record of one click in a raw data log - web data at its ugliest.
The type of information recorded in this weblog depends on what the site developers are interested in. Many sites care about things like what part of the page visitors click on, how long they spend on a particular page, or what they clicked on when they were in one part of the site vs. another, and they record whether these things happened in the weblog.
Data is pretty unusable in this form, a) because there's so much of it and b) because usually we are not interested in the exact millisecond during which a single user clicked on "http://www.huffingtonpost.com/2012/08/17/lindsay-lohan-braless-major-sideboob" which is the level of this kind of record.
Raw weblog data gets organized into summarized, usable database tables via a couple of data processing steps. Sometimes intermediate tables are used to help calculate sums, groups, and values at the level we are interested in. For example, variables recorded at very granular time intervals might later be summed or averaged in longer groups of time. Storing what happened in the past hour or day is intuitive, whereas its hard to think of when you would need to know the exact millisecond a user clicked on something. You end up with tables that have a structure closer to what you might remember from the datasets you saw in the Intro to Stats class you aced, and these can be regularly used by developers or analysts without much hassle/manipulation.
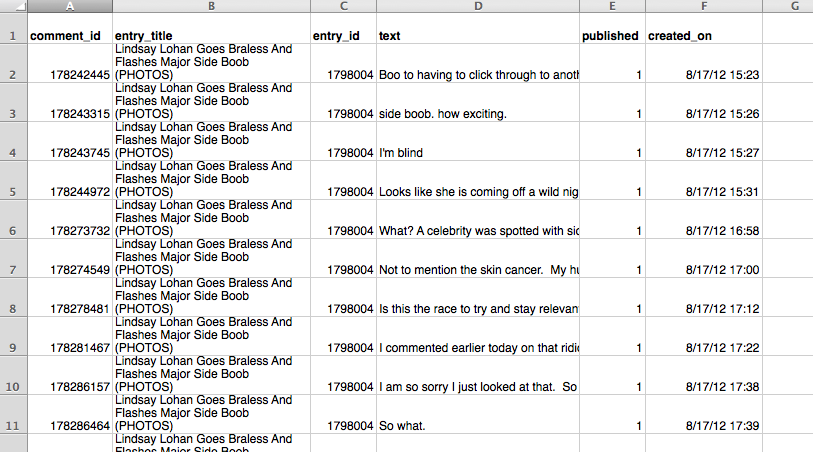
Figure 2: A summary table.
When data is in this summarized form, it can be reused by the website to do things like populate links in the sidebar, collect a user's comment history, or let us know when a topic is important enough to necessitate its own news page.
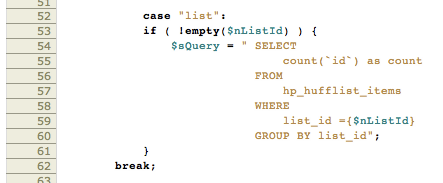
Figure 3: Code sample pulling info from a summary table in the database.
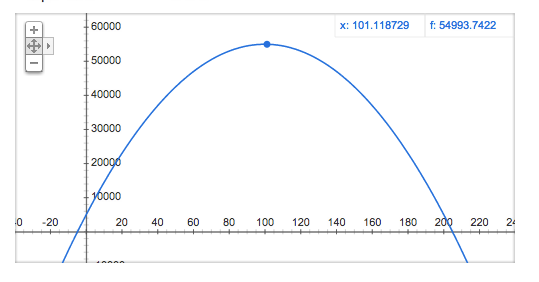
Figure 4: A useful graph made from data!