When 1 in 10 entrepreneurs work 70 hours a week, it's a safe bet that business owners have a lot of issues competing for their attention. Making a great product, generating sales, building customer relationships and managing employees are often the most pressing issues for business owners.
It can be easy for big-picture questions to slip to the bottom of the to-do list. But it's important to step back and assess the health of your business from time to time. Knowing how great you are at making money or managing resources is the first step in making sure you spend your time and business resources wisely. Failing to recognize shortcomings early on can have disastrous consequences.
Indeed, a University of Tennessee study found that nearly half of startup failures could be blamed on "incompetence" - a category that researchers said included "living too high for the business," no knowledge of pricing and "emotional" pricing.
Looking at financial metrics that are important to business health can help you recognize if there are problems with pricing or expenses. "Truly understanding those metrics and gauging your performance against competitors using benchmarking data can give you a clearer picture of both strengths and areas that need fresh attention," said Brad Schaefer, an analyst with Sageworks, a financial information company.
Here are six key financial metrics that can help you understand your business and how you're faring against peers, according to Schaefer:
• Pre-tax net profit margin
• Current ratio
• Quick ratio
• Accounts payable days
• Accounts receivable days
• Inventory days
If you have an accountant or someone preparing financial statements or tax returns for you, they should be able to provide you these metrics easily and give you additional context as well. But below are brief explanations of how each reflects your business health.
Pre-tax net profit margin. Probably the most important metric, this tells how much profit you get to keep from each dollar in sales. For private companies, it is usually expressed as net profit before taxes in a given financial period divided by sales.
"This number can show you how effective you're being with expenses and if you should decrease certain expenses so that they don't eat up as much of the revenues," said Schaefer. The average net profit margin for private companies is around 7 percent, according to a financial statement analysis by Sageworks for the 12 months ended Aug. 1. But it can vary dramatically, by company and by industry. Legal services firms had average margins of nearly 20 percent for the last 12 months, but gas stations' average margins were about 2 percent, Sageworks data shows.
Through its cooperative data model, Sageworks collects financial statements for private companies from accounting firms, banks and credit unions, and aggregates the data at an approximate rate of 1,000 statements a day. Net profit is adjusted to exclude taxes and include owner compensation in excess of their market-rate salaries in order to provide a more accurate picture of the companies' operational performance.
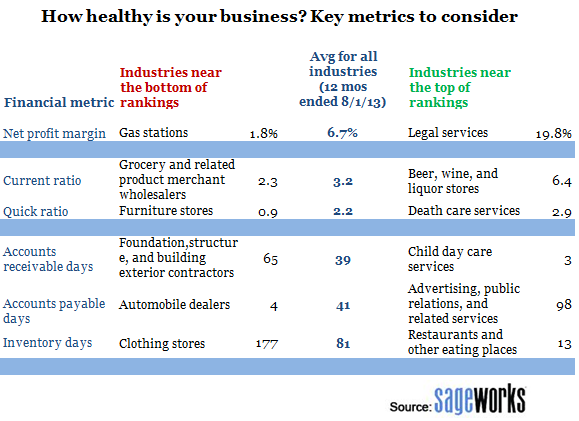
Current ratio and quick ratio. These two metrics give you an idea of your liquidity, or how well you can meet your near-term obligations, and they are most helpful analyzed together. "If the business does not have decent liquidity, then one unexpected expense could severely hurt it," Schaefer said.
Current ratio basically shows whether the assets that you can convert into cash quickly (within a year) will cover what you must pay off soon (in less than a year), and it is expressed as current assets divided by current liabilities. A ratio of less than one means you could run short of cash within the next year unless you generate additional cash. But the metric has some limitations, Schaefer noted.
"For example, by including inventory in the calculation, it may provide a distorted understanding of the company's very short-term cash flow," he said. The average current ratio for private companies in Sageworks' database is 3.19, based on financial statements for the 12 months ended Aug. 1.
The quick ratio shows that shorter-term view; it divides cash plus accounts receivable by current liabilities. The average private company's quick ratio is 2.15.
Accounts payable days and accounts receivable days. These ratios help show how you're managing the company's cash position so that at any point in time, you have enough to cover commitments.
"Accounts payable days can indicate whether you're paying your suppliers too quickly," Schaefer said. "That's money you could be investing instead of distributing immediately. " Schaefer said. (Accounts payable days is expressed as accounts payable divided by cost of goods sold, multiplied by 365 days.)
What is a good accounts payable turnover ratio? Generally, higher numbers are better, but it can vary by industry pretty dramatically. Private companies had an average accounts payable ratio of about 41 days in the 12 months ended Aug. 1, according to Sageworks data. But for automobile dealers, the average is roughly 4 days, and it's 98 days for advertising and public relations companies.
Accounts receivable days, meanwhile, can alert you when you're not receiving payments from customers quickly enough. (It is expressed as accounts receivable divided by sales multiplied by 365 days.) Generally, lower numbers are better for accounts receivable, because it means you're getting cash quickly. But this, too, will vary dramatically by industry. For example, some industries routinely give customers a 30-day grace period for payments, especially those that bill for services. Other industries don't get paid until the entire job is complete. Some types of construction contractors, for example, have an average accounts receivable days ratio of 65, compared with child day care operators' average AR days ratio of about 3, according to data from Sageworks. For all industries, the average AR days ratio is 39.
Inventory days. The inventory days ratio (inventory divided by cost of goods sold, multiplied by 365 days) measures the number of days it takes to move inventory, but it is very specific to the industry. For example, restaurants' products have a short shelf life relative to a clothing store's merchandise. The average privately held restaurant has an inventory days ratio of 13, while it is 177 for clothing stores, on average, according to Sageworks data. Generally, lower numbers are better, because you want to turn over as much inventory as possible in a year.
Because all of these metrics can vary by type of industry, it's difficult to make sense of financial ratios unless you find quality benchmark data.
Trade groups, surveys and information providers are among the resources for finding benchmarking data. The important thing is to find businesses of a similar industry, revenue size and geographical location.
"Business conditions can vary greatly between different areas of the nation, even if the companies are the same size and they make the same products," Schaefer said.