iPhone app iPad app Android phone app Android tablet app More

'Likely' Voters: How Pollsters Define And Choose Them

First Posted: 10/05/10 06:32 PM ET Updated: 05/25/11 06:55 PM ET

Voters

We have seen the "likely voter" polling problem rear its head several times in recent weeks, but few examples have been as vivid as three national surveys released in the last 24 hours.

First, Rasmussen Reports released their latest weekly automated survey of likely voters, which shows Republicans leading by a narrow 3-point margin (45% to 42%) on the question of which party's House candidate voters prefer in their own district. A few hours later, Gallup published two sets of results, each based on slightly different applications of its classic likely voter model. These showed Republicans winning the generic by huge margins of either 13 points (53% to 40%) or 18 points (56% to 38%), depending on the assumptions they made about the level of turnout. Meanwhile, a new survey out this morning from ABC News and The Washington Post put the Republican margin on the generic House ballot question at 6 points (49% to 43%).

Needless to say, those numbers can't all be right. The enormous variation has left a lot of reporters and readers emailing to ask, just how do pollsters identify a likely voter? More important, does anyone know what the heck a likely voter is anymore?

That question is arguably the most important polling story of the year. The answer is not obvious, but the basic issue is simple. There were roughly 213 million eligible adults in 2008, but only about 68% of those adults told the U.S. Census that they were registered to vote and only 62% turned out to vote (up from 60% in 2004). More important, turnout is typically much lower in midterm elections. The turnout among eligible adults was 40% in both 2006 and 2002.

So conceptually, this is a simple problem: It doesn't make sense to interview a sample that represents all registered voters, when somewhere between a third and half of those who say they are registered voters will not vote.

The hard part is figuring out who the true "likely voters" really are. Part of the problem, of course, is that some of those who will actually vote don't know yet that they will (and vice versa). To paraphrase my friend, political scientist Joel Bloom, the 2010 electorate is "a population that technically does not yet exist." It is, rather "in the process of becoming one."

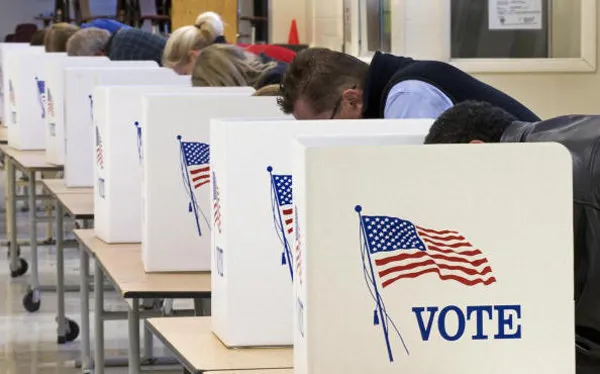
But why not just ask people whether they plan to vote? You can, and pollsters do, but the challenge is that survey respondents often exaggerate their true intentions, even on the eve of an election. Consider the following questions asked by the Pew Research Center less than a week before the midterm elections of 2006 (I've recalculated their results out of a base of all adults):

  • 68% said they were registered and planned to vote in the upcoming election
  • 54% said they were registered and rated their likelihood to vote as a 10 on a scale of 1 to 10

The obvious problem there is that just a few days later, only 40% of eligible adults actually voted. Obviously, many voters will say the they plan to vote when the don't.

Despite these problems, "do you plan to vote" questions do have some predictive value, as shown by an experimental survey conducted by the Pew Research Center in 1999. The Pew pollsters did a pre-election survey on the Philadelphia mayor's race, then after the election, used public records to identify which of their respondents actually voted. Their vote "validation" data shows that the 10-point likelihood question was modestly predictive of voting, even if many of the "very likely" respondents did not vote. As the following table shows, those who rated their likelihood of voting as a 10 on a 10-point scale were more likely to have actually voted (84%) than those who rated their likelihood as a 9 (71%), an 8 (46%), or 7 or lower (roughly 37%).

2010-10-05-Blumenthal-PewValidation.png

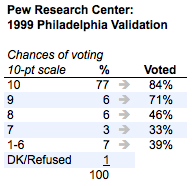
A separate calculation showed that if they had simply classified as "likely voters" those who rated their likelihood of voting as 7 or higher, they would have correctly classified 77% of the registered voters they interviewed. So this sort of measure provides a crude if imperfect way of at least getting closer to the likely electorate.

There are other questions that are crudely predictive of actual voting. Drawing again from that final week 2006 Pew Research poll, some examples include voters who report:

  • Having previously cast a vote in their precinct (65% of adults)
  • Always or nearly always voting (63%)
  • Knowing where people in their neighborhood vote (63%)
  • Following "what's going on in government and public affairs" most or some of the time (63%)
  • Giving some or a lot of thought to the upcoming election (50%)

Again, none of these are perfect predictors of turnout, and the percentage answering in the affirmative in each case still far exceeds the actual turnout of eligible adults in 2006. However, the 1999 Pew study confirmed that those who report greater intent to vote, a history of past voting, knowledge of voting procedures or high interest in or knowledge about politics a week or so before an election are more likely to vote than those who do not.

In the 1950s, Paul Perry, the legendary president of the Gallup Organization, combined seven questions much like these into an index. The greater respondents score on the index, the greater the the probability that they would vote He then made an educated guess about the likely level of voter turnout -- say 40% of adults -- and used the index to select the 40% of the sample that scored highest on the index. That procedure proved to produce more accurate election forecasts than alternatives they tested, and remains the basic concept still used in the Gallup likely voter model to this day.

Over the years, other media pollsters adopted similar approaches. Gallup still uses it, of course, and pollsters like the Pew Research Center and the ABC/Washington Post poll and others continue to apply close variants.

While the Gallup-style model has its critics, let's set those issues aside for a moment and focus on this point: The classic, seven-question, Gallup-style index-and-cutoff model represents a minority of the "likely voter" polls we are now seeing at the statewide level. Moreover, the approaches that pollsters use vary widely, and resist easy categorization. The simplest way to describe what they do is to say there are a variety of different techniques that various pollsters mix and match. Aside from the classic Gallup model, these include:

  • The CBS/New York Times variant, which is similar to the Gallup approach except that rather than select specific respondents as likely voters, it weights all registered voters up or down based on their probability of voting.
  • The use of two or three questions to simply screen out voters at the beginning of the interview that say they are not registered and not likely vote.
  • The application of quotas or weights to adjust the completed interviews to match the pollster's expectations of the demographics or regional distribution of likely voters.
  • The application of quotas or weights to match the pollster's expectations of the party affiliation of likely voters. I break this one out separately because it remains among the most controversial likely voter "modeling" tools.
  • Sampling respondents from lists that draw on official records of the actual vote history of individual voters, so that when the pollster calls John Doe, they already know whether Doe has voted in past elections.
  • Finally, many believe that the use of an automated, recorded-voice methodology rather than a live interviewer is itself a useful tool in obtaining a more accurate measurement of the intent to vote.

Some pollsters use a few of these methods, some use nearly all, so there are probably as many likely voter "models" out there as there are pollsters.

The tools that pollsters apply also reflects a philosophical difference I have written about before: Most national media pollsters, especially those that apply the classic Gallup index-and-cutoff model, are wary of making a priori judgments about the demographics or attitudes of the likely electorate. They prefer to set up a theoretically-objective mechanism to determine what a likely voter is and trust it to determine the demographics and partisan balance of their sample.

On the other hand, most (but not all) campaign pollsters -- those who (like me in a former life) conduct surveys on behalf of political campaigns -- have grown comfortable about drawing on data from other sources and applying their own judgment about the demographics and even the party identification of the likely electorate.

All of these factors help explain why different polls that all theoretically measure the same "likely" electorate can produce very different results.

Of course, the biggest question of all is whether these tools are working as well in this tumultuous election year as they have in the past. That's the question that I'll take up in the second part of this series.

FOLLOW HUFFPOST POLITICS
Subscribe to the HuffPost Hill newsletter!
We have seen the "likely voter" polling problem rear its head several times in recent weeks, but few examples have been as vivid as three national surveys released in the last 24 hours. First, Rasmus...
 
 
  • Comments
  • 481
  • Pending Comments
  • 0
  • View FAQ
Comments are closed for this entry
View All
Favorites
Highlights
Bloggers
Recency  | 
Popularity
Page: 1 2 3 4 5  Next ›  Last »  (13 total)
HUFFPOST SUPER USER
Middleclassvotingbloc
10:59 PM on 10/13/2010
Rasmussan Polls should not even be apart of the analysis, they always favor Republicans. Rasmussan polls are not even worth look at, it is own by a right-wing, and poll mostly right wing. If Fox and Limbaugh refer to it, that should tell you something. Always ignore an article which starts out siteing Rasmussan.
HUFFPOST SUPER USER
Middleclassvotingbloc
10:55 PM on 10/13/2010
One thing to consider, most of the so call Tea Baggers are felons and won't be able to vote anyway. That is the good news
photo
HUFFPOST SUPER USER
ringmaster
I know I spelled it wrong.
01:23 PM on 10/12/2010
All of these throw out all the first time voters and all 18-20 year olds, those most likely to vote D.
photo
HUFFPOST SUPER USER
PlayTOE
Morals evolved due to cooperative group living
07:33 PM on 10/09/2010
Here is a question to determine your "likely voter" and seperate them from the ones who are not sure.

"What is the address / location of your designated poling station?"
Those who don't know are not voting.
Those who have taken the time to plan this out by becoming informed will almost certainly be taking the time to vote.
11:41 AM on 10/09/2010
Lukewarm or undecided about voting? Please reconsider:

http://www.youtube.com/watch?v=3DRkUU-qhjk
05:49 PM on 10/08/2010
I've been voting since the early 70's and I have never been polled. Really don't hold much on these polls.
12:01 PM on 10/07/2010
Pollsters has zero credibility. You have to earn it and you won't.
01:48 AM on 10/07/2010
Pollsters Are Paid To Predict the Recorded Vote - Not the True Vote

http://richardcharnin.com/2010ElectionForecastModels.htm

The media/pollster drumbeat of a “horse race” is largely based on the LV polls. The focus on LV polls conditions the public to expect a recorded vote which in fact will surely understate the True Democratic share. The pollsters discount the RV sample, fully expecting that their LV projections will be a close match to a fraudulent recorded vote - but they never mention the F-word. They know that votes are miscounted in every election. And so their final LV-based poll predictions are usually quite accurate. Pollsters are paid to predict the recorded vote - not the True Vote.

As Election Day approaches, the MSM gradually phases out RV polls for LV polls which lowball the projected Democratic vote share. And public is prepared for the fraudulent recorded vote-counts that the MSM knows are coming.

Since 2000, LV projections have closely matched recorded vote shares while RV projections closely matched unadjusted and preliminary state and national exit polls. In each election, the final exit polls were forced to match the recorded vote. In 2004 and 2008, the Final National Exit Poll required an impossible returning Bush voter turnout to match the recorded vote.

Unfortunately, most pollsters won’t provide RV samples in the two weeks prior to the election. The media will gush on how close the final LV predictions came to the vote but ignore the real reason: systemic election fraud.
photo
HUFFPOST SUPER USER
h23154
10:36 AM on 10/06/2010
I don't think the results of any single poll mean that much. But when they are consistent over a significant time it's hard to ignore the trend. For example, I have not seen a poll in a very long time, if ever, that shows a Sestak lead in PA above the margin of error, and every poll shows him well behind.
photo
HUFFPOST SUPER USER
sueinmn
09:43 AM on 10/06/2010
Do these polls really work? How many younger adults no longer have home phone lines as the cells are all they need. I have both and have never been polled. Our biggest problem is history reflects low voter turn out on non Pres elections. We must get out the vote! What has been done to attempt to turn around the economy which is still is disaster mode, will be twise baked if repubs get their way. As a 99er, knowing how far we have to go yet, we cannot afford to let it slip away! Both parties are bought and paid for but which is the lesser of the evil? I prefer the party that does something good for society like making sure we still have safety nets to rely on! Dems are weak but Repubs are full of hatred and care only about self preservation of ones pocket book.
07:16 PM on 10/07/2010
I'm almost 60 and I only have a cell phone... and I know many people in their 40s and 50s who only have cell phones. I think pollsters are missing a lot of folks.
11:49 PM on 10/12/2010
This is why many have started including cell phones in their samples..
08:38 AM on 10/06/2010
If she had paid workers $8.00 an hour she could have invested that money to pay the base wages of 8,750 people for a year.
photo
HUFFPOST PUNDIT
keepemhonest
07:54 AM on 10/06/2010
I've learned that FoxNews/Rasmussen polls are so far off base and tilted to the frightwinger that it is important to double the percent for the democrat in all their polls.

See Fox News is now part of Scott Rasmussen's polling firm. And their theory is that:
IF: they (Fox News/Rasmussen) can make up false data & show Frightwingers 10 & 15 points ahead
THEN: The democrats will lose "enthusiasm" to vote

It is what R0ve Playbook refers to as "Appearance" ... give the "appearance" of something to achieve a desired result.
photo
justalurker
edited my micro-bio
09:06 AM on 10/06/2010
Agreed. The good news is they were wrong this summer. The Fox-dominated news narrative was that all incumbents were in trouble with their primaries because of tea party anger. The reality turned out to be that over 95% of incumbents WON their primaries.

The current narrative will also be wrong. Republicans will only take a meager dozen or two house seats, not the 39 they need for control, and nowhere near the 50-70 seats some are claiming.
01:44 PM on 10/11/2010
If Rassmussen is so far off then why were they the most accurate at predicting the 2008 Presidential election?

http://politisite.com/2010/08/06/poll-accuracy-in-the-2008-presidential-election-rasmussen-pew/
photo
cvbnm67
Pursuing truth, and all those who threaten it.
07:03 AM on 10/06/2010
The Republican are confident, and full of hubris, however they should not measure for the drapes or order any carpet yet. I don't care about ads, I will be voting Democratic Party right down the line on all elections, it is the only way to combat the Koch Brothers, Teaparty Republican and the misinformation campaign.

It all depends on us (Democrats), so find your local election office, create your own group, talk to your neighbors and get involved. The Teaparty is counting on a low voter turnout, however we have the numbers and if we vote we win.
HUFFPOST SUPER USER
JavaJuice
07:01 AM on 10/06/2010
I already voted absentee ballot. Straight Democratic ticket in Florida. :)
This user has chosen to opt out of the Badges program
photo
Robert Masters
To take my property is to take my means to live
07:05 AM on 10/06/2010
I'll bet that took a lot of thought and research.
10:42 AM on 10/07/2010
So did your comment.
07:17 PM on 10/07/2010
It doesn't take much research to find out the Republicans have been, and will continue to be, a disaster for America.
HUFFPOST SUPER USER
kitty33
06:32 AM on 10/06/2010
Keep telling yourself that the polls are wrong and American's love the direction Obama is taking us...this will assure Republican control for years to come.
HUFFPOST SUPER USER
JavaJuice
07:00 AM on 10/06/2010
Keep telling yourself that the polls are against Obama being too liberal. Keep telling yourself that the public is in love with the Tea Party. Keep telling yourself that Fox is telling you the truth. Keep ignoring the Democrats are surging in the polls. Keep ignoring how mathematically impossible it is for GOP to take back either House.

Please do continue to believe the media narrative. I will enjoy watching the conservatives scramble for excuses.
10:44 AM on 10/07/2010
People like you -- and, I suspect, including you -- were saying the same thing running up to the midterms in 2006, and the election of 2008.