iPhone app iPad app Android phone app Android tablet app More

Gallup's Generic House Ballot: Why So Different?

First Posted: 10/12/10 11:59 PM ET Updated: 05/25/11 07:00 PM ET

Voters

Why are some pollsters producing results among "likely voters" that vary, either over time or compared to other pollsters? A week ago, I offered a primer on how pollsters define and choose likely voters. Today, I want to consider whether the variation we are seeing is unusual, and if so, what may explain it.

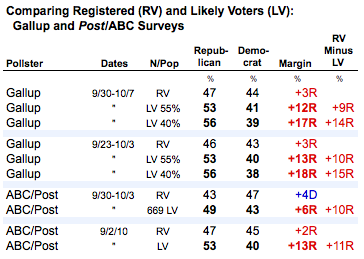
The best example of this phenomenon can be found Gallup's release Monday of their latest results for the national "generic ballot" for Congress. For the second straight week, they found a remarkably negative result for Democrats when they screened for the most "likely voters." Using their traditional likely voter model that assumes a typical midterm turnout of 40% of adults, they found Republicans leading by a whopping 17-point margin (56% to 39%). Using a slightly looser screen that assumes a much-higher than usual 55% turnout, they show Republicans leading by an only slightly narrower, 12-point margin (53% to 41%).

Either way, the result is one of the best for the Republicans in Gallup's 60 years of tracking the national generic ballot, and if accurate, would foretell electoral armageddon for Democrats. According to the political science models, a margin of just five points for Republicans among likely voters on Gallup's final survey would predict a gain of roughly 50 seats, more than enough to attain a House majority. According to Emory University political scientist Alan Abramowitz, a Republican margin of 12 to 13 percentage points would translate into a Republican gain of roughly 80 seats, giving the GOP their biggest majority since the 1920s.

But the generic ballot results from other national polls of "likely voters" have not been nearly as pessimistic for the Democrats. A half-dozen independent media surveys conducted over the last two weeks have yielded narrower margins among "likely voters," ranging from a nine-point Republican lead to a two-point Democratic edge. If we use our interactive chart to select just the pollsters other than Gallup that have released recent results among "likely voters," it shows a five-point Republican lead (47% to 42%) on the generic ballot.

Why the difference? Let's start by looking at how much the results change on the same surveys when Gallup and ABC News/Washington Post narrow their samples from all registered voters to likely voters. The two organizations are the only national pollsters (so far) to report results for both populations. While their reported margins differ, both show similarly large shifts from registered to likely voters. On four polls, Republicans gain roughly 10 or more percentage points on the margin as these pollsters move from registered to likely voters.

2010-10-13-Blumenthal-LVRVGallupPostABC2.png

What is the gap about? Part of it, as we know from decades of research including the biannual reports produced by the U.S. Census Current Population Survey, is that voters tend to be older, better educated, more rural and more white than the population at large, a pattern that is especially evident in lower turnout for off-year elections. Because these demographic groups tend to be more Republican, likely voter models that move poll samples toward a more correct demographic snapshot also nudge vote preference a few points more Republican. Such differences were typically in the single-digit range in 2004 (see examples here and here), and much narrower in 2006 (here and here) and 2008. This year, obviously, those gaps are much bigger and appear to be more variable across pollsters.

Of course, these bigger-than-usual differences are also a reflection of the huge gap in voter enthusiasm observed by various pollsters this year. Republicans have been much more likely to express enthusiasm about voting than Democrats, and that enthusiasm is translating into greater reported interest in the campaign and intent to vote -- two key questions that drive pollsters' likely voter models.

But does the inconsistency among pollsters suggest a new, emerging problem with likely voter screens? Are they simply not working as well this year as in the past? Tempting as it is to spin theories about how these gaps may result from the various new challenges to polling -- cell phones, lower response rates, new technologies and the like -- comparisons to elections like 2006 and 2008, when an enthusiasm gap favored Democrats and thus narrowed the typical differences between registered and likely voters, are misleading. We really need to look back to 1994, the last election in which enthusiasm and turnout skewed decisively Republican.

As it turns out, a search of reports from 1994 shows that Gallup's likely voter model produced similar gaps between likely and registered voters.

2010-10-13-Blumenthal-LVRVGallupTM1994b.png

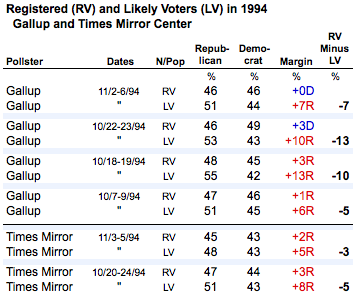
As the table above shows, Gallup (then in partnership with USA Today and CNN) conducted surveys in mid-October that showed Republicans with double-digit leads among likely voters and produced differences of of 10 to 13 points between registered and likely voters. But the surveys by the Times Mirror Center (which later became the Pew Research Center) found much narrower gaps. Ultimately, the Republican lead narrowed on the Gallup likely voter sample to 7 points, much closer to the final Times Mirror poll and in line with the actual popular vote cast for the House (52.1% for the Republicans, 45.2% for the Democrats).

In their release last week, Gallup noted that their likely voter polls have often overstated the margin for leading party in September and early October of off-year elections:

Gallup's historical election trends suggest that the race often tightens in the final month of the campaign. In September and October 1994, 2002, and 2006, Gallup's likely voter estimates showed larger margins for the leading party than what the final estimate showed (with the final poll in 2002 moving from a slight Democratic advantage to a Republican lead in the final poll).

My sense is that some of the big differences we have seen this year -- both in comparing Gallup's results to other national polls and on some polls at the state level -- may be about the way the classic likely voter model behaves in a year in which Republicans are generally more enthusiastic about voting than Democrats. The demographic pattern of enthusiasm reinforces the demographics of those already likely to vote, making the impact of the likely voter model on the overall result that much bigger.

In a typical year, a likely voter model or screen functions like a nudge. It gives polls samples a push toward the demographics of likely voters, and in so doing makes those samples slightly more Republican. That nudge makes them slightly more accurate in predicting the outcome.

With that in mind, consider this imperfect metaphor: In a typical year, the LV model is like giving a shopping cart a nudge on a level surface. It will roll a few inches, but no more. Years like 1994 and 2010, however, are like giving that same cart a nudge on an incline. Nudge it too much, and the cart will roll down the hill.

(To be fair, Gallup reported last week on the demographics of its new likely voter sample and found a "typical" composition by gender, age, race and education, but found that likely voters were far more Republican and conservative than in previous elections, including 1994).

It is also important to remember that the "science" of likely voter models derives from polls taken during the last week of the campaign. Over the years, pollsters have looked closely at their final polls before the election -- sometimes collecting actual respondent turnout data to see which voted and which did not -- to see what changes or alternative models would have more accurately predicted the outcome. The challenge, especially with models that rely on multiple-question indexes, is that their accuracy when applied to polls taken a month or more before the election is unknown.

So don't be surprised if Gallup's bigger than average generic ballot margin narrows over the next three weeks, and don't be surprised if similar differences in some statewide polls narrow as well.

I have more to say about the science of likely voter models and what pollsters can do to mitigate these big swings in likely voter demographic composition, but I will save that for another post. To be continued ...

FOLLOW HUFFPOST POLITICS
Subscribe to the HuffPost Hill newsletter!
Why are some pollsters producing results among "likely voters" that vary, either over time or compared to other pollsters? A week ago, I offered a primer on how pollsters define and choose likely vote...
 
 
  • Comments
  • 1,073
  • Pending Comments
  • 0
  • View FAQ
Comments are closed for this entry
View All
Favorites
Highlights
Bloggers
Recency  | 
Popularity
Page: 1 2 3 4 5  Next ›  Last »  (13 total)
photo
Constance Goforth
Hold to the truth
04:52 PM on 10/13/2010
2010 is a tough election for Independent voters. Groupthink within both parties means we've got a choice between the fire and the frying pan. although it's pretty safe to say Republicans will sweep this election.

http://rubylee1776.wordpress.com/2010/10/13/two-party-groupthink-leaves-independent-thinkers-cold/
photo
HUFFPOST COMMUNITY MODERATOR
Extranjero
living the American dream in Central America!
12:43 PM on 10/13/2010
No matter what the polls say, if the modern trends hold true, the country will move that much closer to the edge of the cliff. Nothing will get done by the govt in the next 2 years, with the wingnuts threatening to shut down govt. They will pursue a policy that the private sector will correct the problems that they created. Totally insane! Time to dust off the passports and head for greener pastures!
03:02 PM on 10/13/2010
bye
05:18 PM on 10/13/2010
bye bye.

...because the growth of government had led us here...growing it more will lead us back? C'mon.

If you want change, vote to reduce the multiplying sclerosis that is our Federal Government.

A vote for Obama is a vote for more of the same.
photo
HUFFPOST COMMUNITY MODERATOR
Extranjero
living the American dream in Central America!
07:36 PM on 10/13/2010
Dont waste your goodbyes...........I left years ago...........Good luck to you!!!!
conservo
Tea Partier, Atheist, Libertarian, Objectivist
09:20 PM on 10/13/2010
Fanned!-------For speaking truth.
conservo
Tea Partier, Atheist, Libertarian, Objectivist
12:29 PM on 10/13/2010
I keep hearing that these polls (and coming election) represents America's anger with incumbents------Nonsense! The whooping that the polls are projecting the Dems are going to recieve on November 2 represents voter anger over the far left policies that Obama and Congress are forcing down our throats (ie. frivolous spending and bailouts that add to the debt). Make no mistake about it, the Republicans spent wildly , too, when they had control of Congress. But the best way the Dems could have capitalized on that would have been to counter that with fiscal prudency. Instead they chose to double down on the spending. Well, some Republicans ARE getting the message---that is why they will emerge victorious.....as the Dems continue to ignore (and mock) the will of the people.

------------------------------NOVEMBER----------------------------------------------
03:02 PM on 10/13/2010
agreed
12:08 PM on 10/13/2010
The polls show one thing repeatedly.
We are headed for trouble, 95,000 jobs lost in Sept. Millions of homes in foreclosure.
The government will soon begin to fight for it's own survival which means heavy taxes to maintain it's posture overseas, the stripping of domestic spending and the abandoning of a new found domestic agenda.
If you read the news that is not the media infotainment you will realize that what you are told is not false but is not true either.
When you can't afford to heat your home or drive you car perhaps then the Polls will mean something.
Perhaps we can elect the Party that will produce jobs and reduce the cost of energy, more than likely we will elect more Politicians that will produce fewer jobs, higher taxes and shelter the energy companies from accountability.
You had better get all your loved ones together and tell them that times are going to get tough.
You will be put out of your home if you do not pay the bank, at retirement age you will be looking for a job; any job.
The Polls this, the Polls that, I am a Republican, I am a Democrat, Profiteering continues unabated while the Federal Government is confounded as to what to do, postures and applies band aids.
We have learned to be the most affluent Nation on earth, we are about to learn something else.
12:04 PM on 10/13/2010
Don't really get your gobbledegook arguments even though I have done well in math and logic in my life!! The bottom line is that Democrats are hosed, big time!!
photo
HUFFPOST SUPER USER
Bert Dodson
libral gramma
11:50 AM on 10/13/2010
polls prove that observation can change the behavior of those being observed. politician who strive to be popular with the poll will end doing nothing more than legislating national nice day. alway rember slavery was popular, women voting was unpopular, child labor was popular, lynching popular, catholic/jew unpopular, jim crow/chu chan laws popular, guess what popular does not equate with moral
This user has chosen to opt out of the Badges program
photo
boomer7391
Beliefs are the seeds of evil.
11:43 AM on 10/13/2010
When the largest upset in american elections leaves the gop stunned and questioning the polls it might be a good time to raise the obvious point....pollsterst don't call cell phones...I haven't had a land line in 10 years....and they call land lines...old folks have land lines and they're mainly republican...the rest of us who actually live in the 21st century have never been called by a pollster and surpriise! we're going to vote.
12:03 PM on 10/13/2010
All things are possible in Obamaland....oh look...a unicorn!
12:06 PM on 10/13/2010
Dream on! You have less than 3 weeks left after which you have to jump off of a bridge in despair!!
photo
HUFFPOST SUPER USER
KatieAnnieOakley
Exposing GOP hypocrisy every chance I get...
11:28 AM on 10/13/2010
Funny story... and true.

Gallup called last month... they ASKED for my hubby (Republican); I said he wasn't in, but I (obviously...) was, and that I'd be glad to take their poll. They told me flat, NO.

This tells me that while Gallup represents itself as unbiased, it in fact got my husband name (and only his name - I'm an Independent) from SOMEWHERE...

On the Robo calls asking for him, I vote Democratic... I just push the corresponding buttons on the phone. This instantly stops that Robo call from ever interrupting me again...

HINT: there is more - much more to this story...
12:06 PM on 10/13/2010
Are suggesting Rubio is not leading by a wide margin...if that is the case...you are drinking way too much!
HUFFPOST SUPER USER
PostModernGuy
12:14 PM on 10/13/2010
Curiously, I've never received a Robo call, and very few survey calls. My wife receives some survey calls. Guess who's registered as a Republican? (And guess who's changing it because she's tired of all the calls?)
photo
HUFFPOST PUNDIT
jsgaetano
Legum servi sumus ut liberi esse possimus
11:05 AM on 10/13/2010
And now we know why Gallup is the greatest name in far right narrative creation.

Election prediction... not so much.
05:32 PM on 10/13/2010
Where were you when they were the only poll showing Democrats leading on the generic ballot?

Fair weather fan, boo-hoo!
photo
nfatt1
Liberty, Equality, Fraternity
11:03 AM on 10/13/2010
"Garbage in, garbage out."
HUFFPOST SUPER USER
sarabono
Oldie but Goody
11:02 AM on 10/13/2010
I'm a Generic People and I Vote !
photo
HUFFPOST SUPER USER
Ohio5470
11:01 AM on 10/13/2010
In 2006 the AVERAGE generic poll in the final week before the midterm elections had the Democrats up by 11.5 points. In the ensuing election the Democrats gained +6 and +31 in the Senate and House respectively. I would really hesitate on using one poll to describe voter generic preference. One might use previous Gallup polls as predictive indicators but one has be sure that its current polling model is the same as previous yearsor we can't really assume a correlation. And this year pollsters are admittedly experimenting with differrent models.

And why should we ignore other pollsters such as Bloomberg and Democracy Corp that had Republicans and Democrats statistically even for the same period?

I follow election projections that survey each electoral contest in the house and senate. If one assumes a worst case scenario for the Democrats, that is all tied or to close to call going for the Republicans weI get a 52-48 Republican majority in the Senate and a 250-185 Republican majority in the House. Reversing this scenario gives a 52-48 majority to the Democrats in the Senate and a 224-211 majority for the Democrats in the House.
My prediction is the Republicans take control of the house by 10 seats while the Senate is too close to call. Yet regardless of the outcome the legislature will be hopelessly gridlocked as it has been for the last year and a hal. primarily due to Republican intransigence
photo
HUFFPOST BLOGGER
Joe The Nerd Ferraro
Group IQ is inversely proportional to group size.
photo
HUFFPOST PUNDIT
Chucktheman
10:57 AM on 10/13/2010
Obama won by a landslide. The polls all had him down and out for the count. : )
05:35 PM on 10/13/2010
No they did not.

They had him winning by 8 points. The poll averages got it right with amazing accuracy. RCP poll average nailed the final outome.
03:47 AM on 10/14/2010
What polls are you talking about? The ones six or months before the election?

The ones in the last 3 weeks where we are now had him pulling away.
HUFFPOST SUPER USER
Cathy Brabant
10:56 AM on 10/13/2010
Generic people don't vote or run for office.
05:36 PM on 10/13/2010
No, they have to run as Democrats. That is why they are getting slaughtered.