Hunch, a personal recommendation service, has surveyed 15,818 of its users to determine the average demographic, personality, and lifestyle of iPhone and Android consumers.
So do the stereotypes hold true?
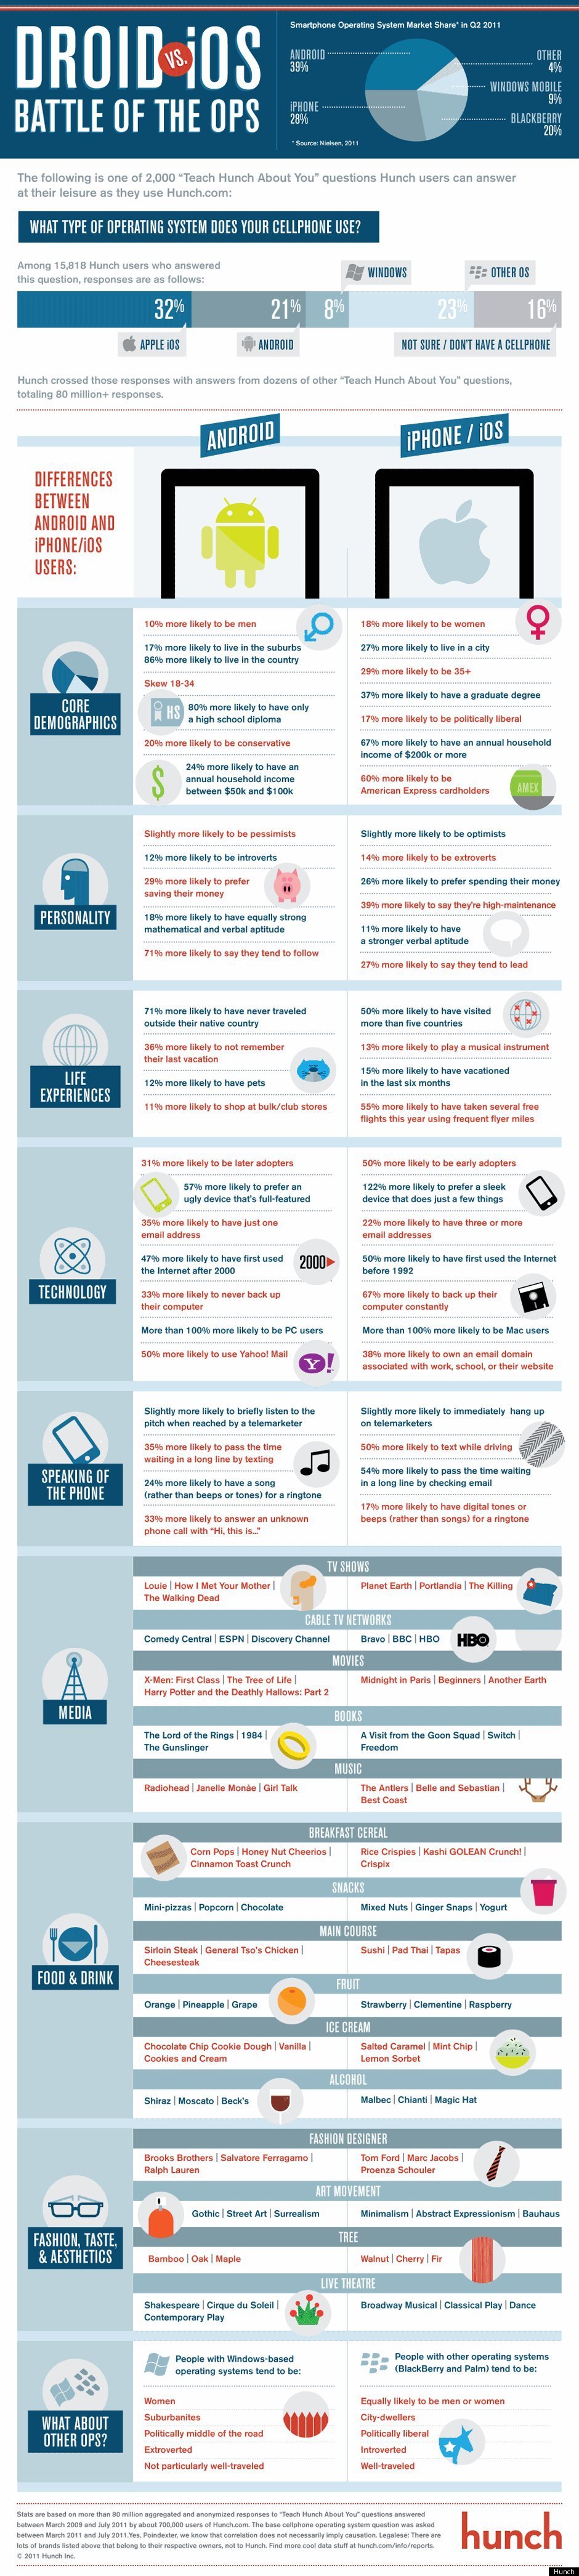
Hunch found that iPhone users were, on the whole, more likely to be optimists, extroverts, self-described "high-maintenance" individuals and leaders, and more willing to spend money, while Android users were more likely to be pessimists, introverts, have a preference for saving their money, have pets, and be later adopters. The survey even probed differences between snack and cereal choices between the two types of users (iPhone users apparently prefer Malbec and Chianti when it comes to wine. Android users opt for Shiraz and Moscato.).
Of the users surveyed by Hunch, Android users were more likely to be men, ages 18-34 who lean to the right politically. Conversely, iOS users tend to be women over 35 years old and are "17 percent more likely to be politically liberal," according to Hunch's data.
It's important to note that Hunch's survey does not offer a complete picture of smartphone users. Among the people Hunch surveyed, 32 percent reported using a smartphone running Apple's iOS platform, while 21 percent said they use Google's Android. By contrast, 8 percent said they use Windows, and 23 percent said "other." Hunch then compared these data with statistics from the second quarter of 2011 collected by Nielsen that break down the U.S. smartphone market. According to Nielsen, Android enjoys the largest share of the U.S. market (39 percent), while Apple follows at 29 percent.
Hunch also painted a brief portrait of the types of users that opt for other operating systems. Among the oher interesting takeaways: Windows OS users tend to be surburbanite, women, and "not particularly well-traveled," and Blackberry users are more likely to be well-traveled, politically liberal and city-dwellers.
After Hunch posted an infographic of the data on its blog, readers took to the comments to refute the report. One commenter named "Alliedcvil" said, "I have been an Android user for a very long time now and none of the statistics actually apply to me or the other Android users I know". Another commenter who goes by "Rohan" remarked, "This does show Android users in a very negative light an I really find it hard to believe even though I personally use an iPhone."
The rest of Hunch's findings are presented in the infographic (below), created by Column Five Media.
For more on Android vs. iPhone users, check out this recent study conducted by Jumptap showing which U.S. states prefer certain mobile operating systems. The report found that the South and Southwest tend to be Android-biased and the Midwest and Northeast lean towards iOS. Another survey by TeleNav asked users of different mobile operating systems to rank what they'd rather give up for a week, from sex to toothbrushes, than their phones. See their findings here.