WASHINGTON -- The already controversial Gallup Daily Poll raised even more eyebrows on Thursday with the release of daily tracking results showing Republican nominee Mitt Romney leading President Barack Obama by 7 percentage points (52 to 45 percent) among likely voters nationwide.
The latest Gallup result was by far the most favorable to Romney among national polls released over the past week. Nine other organizations using a wide variety of different methodologies showed results ranging from a 4 percentage point lead for Romney lead to a 3 point advantage for Obama.
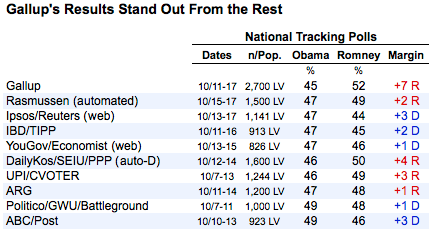
The HuffPost Pollster tracking model, which combines all of these public polls as well as state level surveys into a national popular vote estimate, continues to show Obama and Romney in a virtual tie.
Before examining the Gallup Poll, it may be worth considering some general advice: If one poll produces results that are at odds with nine others -- for whatever reason and no matter who produced it -- that one poll is probably off.
Many find that advice difficult to take given Gallup's long history and special prominence. So why is the Gallup result so different?
The most obvious answer is its likely voter model, which has helped produce large and seemingly inexplicable shifts and differences with other polls in the past.
In 2000, for example, Gallup's daily tracking survey showed Republican nominee George W. Bush going from a 9 percentage point deficit against Democrat Al Gore to an 8 point lead in just three days following the first presidential debate. Other polls done at the same time also showed movement to Bush, but the average overall shift in the margin separating Bush and Gore was roughly 2 percentage points, not 17.
A subsequent study by political scientists Bob Erikson, Costas Panagopolous and Chris Wlezien found that most of the shifts in 2000 were "not change due to voter conversion from one side to the other," but rather "shifts in the type of respondents who score as 'likely voters' or 'unlikely voters' from one period to the next."
When Erikson and his colleagues examined the trends among all registered voters in Gallup's tracking polls for 2000, they found far more stability. "If the tracking poll had reported the preferences among registered voters," they wrote, "there would have been less evident change."
Over the past 10 days since Gallup started reporting its tracking results among likely voters, the results have typically shown a reasonably constant gap -- roughly 5 percentage points -- between the likely and registered voter samples. On Thursday, Gallup gave Romney a 1 point edge (48 to 47 percent) among registered voters.
Four years ago, as this year, Gallup did not begin releasing likely voter samples until early October and its results were reasonably stable over the final 20 days of the campaign.
In 2010, Gallup's final poll reported Republicans leading Democrats by 15 percentage points (55 to 40 percent) among likely voters on the national "generic" ballot -- the question that asks voters whether they will support the Democratic or Republican candidate for Congress in their district. No other national poll had reported Republicans with as big a lead.
While Republicans gained 63 seats in the House in 2010, their margin in votes cast nationwide was just 6.8 percentage points (51.6 to 44.8 percent). Gallup's final estimate among all registered voters, which gave Republicans a 4 percentage point lead, came far closer.
Ultimately, solving the mystery of Gallup's currently divergent result is difficult, particularly since it does not routinely disclose the demographic or attitudinal composition of its likely or registered voter samples. Gallup regularly publishes extensive data showing results among subgroups, but its tables show only the unweighted number of interviews in each subgroup, not the weighted values.
Gallup's results are very different, at least for now, compared to most of the national polls, just as they were in 2010. The best advice may be what political scientist and blogger Jonathan Bernstein offered his readers: As "with every polling number," he wrote," "ignore it, and look at the polling averages."
*************************
What's happening in your district? The Huffington Post wants to know about all the campaign ads, mailers, robocalls, candidate appearances and other interesting campaign news happening by you. Email any tips, videos, audio files or photos to openreporting@huffingtonpost.com.
Before You Go