
Barack Obama's approval rating continues a year-long decline, but the causes are the subject of debate. Chris Christie's ratings in New Jersey have remained high since Hurricane Sandy. And we check in with an eight-year-old aspiring pollster. This is HuffPollster for Friday, November 8, 2013.
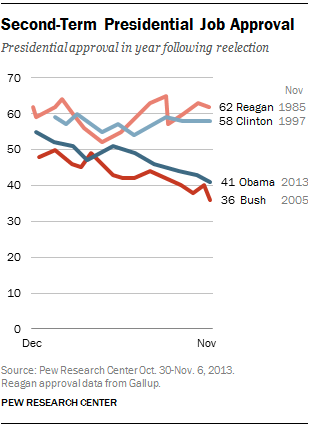
OBAMA'S SECOND TERM SLUMP CONTINUES: Pew Research - "Barack Obama has had a difficult year since his reelection victory. His overall job rating stands at 41%, down 14 points since last December. A majority (53%) now disapproves of the way he is handling his job as president….Obama’s second-term job ratings have followed a similar downward trajectory as those of his predecessor, George W. Bush. A year after his reelection, 36% approved of Bush’s job performance, down from 48% in December 2004. In contrast, the two prior presidents who won reelection – Bill Clinton and Ronald Reagan – enjoyed positive ratings over the course of the next year. At comparable points in their fifth year in office, 58% approved of Clinton’s job performance while Reagan’s job rating stood at 62%." [Pew]
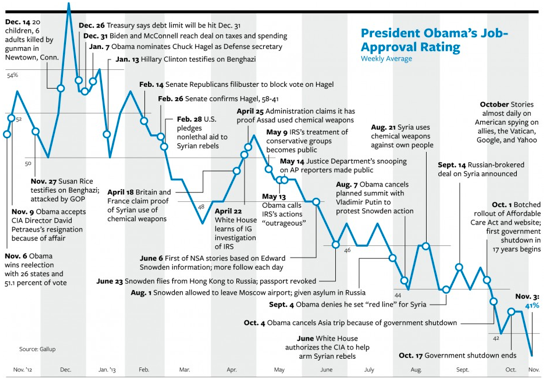
DEBATING AN OBAMA JOB APPROVAL CHART - The National Journal's Brian McGill and George Condon produce a chart of the Obama approval trend line from the Gallup Daily tracking poll annotated with various news events during the year. The chart appeared under the headline, "Why Obama's Approval Rating Is Down." [National Journal]
Political scientists object:
-Brendan Nyhan: "Ack - those events not necessarily causal...Better to use smoothed polling average - most of decline is post-reelection bump burning off [Link to Pollster chart below]." [@BrendanNyhan via Storify]
-Jonathan Bernstein: "That [National Journal Obama] approval chart is awful...It's 10 points in 12 months; that's real, but chart scale overemphasizes drop...2. There's no way to know from it which of these day-to-day stories had any effect on approval...3. It omits entirely most economic stuff, including what I suspect is the big driver: reduced deficit/sequestration. [@JBPlainblog via Storify]
CHRISTIE'S FAVORABILITY SOARS - Rutgers-Eagleton: "As voters headed to the polls Tuesday, Gov. Chris Christie’s re-election bid was buoyed by some of his highest favorability ratings – 65 percent – since February 2013, according to the Rutgers-Eagleton Poll. Christie’s new ratings were nearly as high as they were right after Sandy, when 67 percent of respondents had a favorable impression and 61 percent awarded him at least a B. As he concludes his first term, Christie’s favorability rating is more than 20 points higher than it was just weeks after his inauguration in January 2010. Despite Christie’s overall consistently high ratings, voters continued to question his performance on important issues. Near the campaign’s end, voters remained less than happy with his performance on taxes (42 percent) and the economy (45 percent). Voters were more taken with Christie’s Sandy recovery effort (80 percent approving), which kept his overall ratings high throughout the year." [Eagleton Poll Blog]
"SUPPORT FUTURE POLLSTERS," EPILOGUE - Regular HuffPollster readers may recall that in July we passed along the story of Noah, an enterprising 8-year-old who created a survey on public transit on Survey Monkey. We also solicited advice for the young man from a handful of survey research professionals. [HuffPollster here and here]
The rest of the story - On Friday, Noah's mother Marcella Campbell provided a complete account of his survey and the response that followed: "My son, Noah, has always been obsessed with subways, trains, and buses...One morning, Noah and I came across a fascinating study of San Francisco’s Municipal Railway, which led to a discussion about the balance between accessibility and efficiency. Noah thought it might be interesting to find out how people get to their local public transit stop, in an effort to see how accessible our area’s public transit really is. If more people drove to their public transportation than walked, it would mean public transit wasn’t as accessible as it could be." After exploring "different ways to get the information," Noah and his mother "came around to creating a SurveyMonkey survey."
With a goal of 50 responses, Marcella posted a link on her Facebook page and sent out a tweet. "The tweet was retweeted 120 times, by very nice people who wanted to help out a fellow data enthusiast. Soon, it had gone worldwide. Hundreds of people from every habitable continent were taking Noah’s survey! Noah’s eyes were glued to the screen all day…and he got up and checked the survey as soon as he was awake the next morning, reading all the states and countries represented. It seemed that, every time he logged in, another 50 or 100 people had taken his survey. At one point, to my surprise, I caught him wiping away tears. 'Why are you crying?' I asked him. 'My survey is really good! I’m crying because I’m happy!” he said. [SurveyMonkey]
HUFFPOLLSTER VIA EMAIL! - You can receive this daily update every weekday via email! Just enter your email address in the box on the upper right corner of this page, and click "sign up." That's all there is to it (and you can unsubscribe anytime).
FRIDAY'S 'OUTLIERS' - Links to more news at the intersection of polling, politics and political data:
-Most uninsured Americans have not visited a health care exchange. [Gallup]
-Americans who know more about the NSA are more inclined to dislike it. [Lawfare via The Monkey Cage]
-Americans distrust government health care, except if it's Medicare. [YouGov]
-The American Enterprise Institute (R) compiles public polling on conspiracy theories. [AEI]
-Andrew Kohut says the Republicans are in better shape than you think. [WSJ]
-Frank Newport reviews trends in Gallup tracking of economic confidence. [YouTube]
-Virginia proves that demographics still matter, writes Amy Walter. [Cook Political]
-The Harvard Gazette profiles Peter Hart (D). [Harvard]
-The latest issue of AAPOR's Survey Practice is available. [SurveyPractice]
-The American Enterprise Institute compiles public opinion polls on conspiracy theories. [AEI via @BrendanNyhan]
-TGIF. Here's an appropriately lazy pie chart. [Twitter]
Before You Go
