Evidence from Gallup's weekly presidential approval results indicates that the racial makeup of its tracking poll changed dramatically between the final week of September and first week of October -- a change that coincides with the beginning of Gallup's reporting of likely voter results in the presidential election.
Although Gallup does not report the racial composition of its tracking poll sample in its weekly presidential approval results, we can estimate the racial makeup of the sample by extrapolating from the reported approval rating of the president among whites, nonwhites and all adults. The estimated nonwhite percentage of the sample for the past five weeks was as follows:

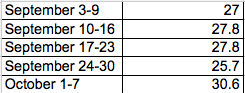
Given the size of Gallup's weekly adult sample, typically over 3500 respondents, the increase from the previous four weeks to the first week of October is very unlikely to be explained by random variation alone. This change, however, does bring the nonwhite share of Gallup's sample much more closely into line with the 2010 Census estimate of the nonwhite share of the U.S. adult population which was 31.8 percent.
In the past, some observers -- including Mark Blumenthal of the Huffpost Pollster -- have criticized Gallup's sampling procedures for under-representing nonwhites in their tracking poll. Assuming that the change seen in the first week of October is permanent and not just a one week aberration, the increase in the percentage of nonwhites in Gallup's latest weekly tracking poll sample is a welcome development that should produce more accurate estimates of not only presidential approval but also support for the presidential candidates among registered and likely voters.
![]() |
![]() |
|
| Obama | Romney | |
|---|---|---|
| Electoral Votes (270 to win) |
332 | 206 |
| Obama | Romney | |
|---|---|---|
| Total | 65,899,660 | 60,932,152 |
| Percent | 51.1% | 47.2% |
| Democrats* | Republicans | |
|---|---|---|
| Current Senate | 53 | 47 |
| Seats gained or lost | +2 | -2 |
| New Total | 55 | 45 |
| Democrats | Republicans | |
|---|---|---|
| Seats won | 201 | 234 |
http://www.gallup.com/poll/154577/Election-2012-Weekly-Demographic-Data.aspx
Between 9/17 and 10/7 "non-whites" composed less than 17% of their total 9,000+ person sample.
We are also asked to accept this change......has absolutely nothing..........to do with the Holder DOJ joining a lawsuit........against Gallup on August 22,2012.....a scant five weeks before this 20% change in the racial demographic that simply favors this President.
This morning we're told first time unemployment claims fell by 30,000, to the lowest since 2008. Its not till hours later, after the headlines and the stock market rises 100 points on the news, ending a three day slide, that we're told.......uh oh......California is missing from the BLS number.
California, the most populous state, who's own unemployment is two full points higher than the national average.
I know........its all coincidence......keep moving....nothing to see here......ignore all those conspiracy nuts....prosperity is right around the corner......
I'm SHOCKED...SHOCKED I tell you!
We've only been SAYING this for some time.
The polls have been giving Democrats anywhere from +8 - +14 points because they were using the turnout from the 2008 Presidential Election.
They would have done BETTER to us the figures from the 2010 elections. Or for that matter, just to make it all even up. Either way, Romney would be ahead of Obama!!!
Too many polls try to shape public opinion rather than measure it. To Gallup's credit, they did not buy into the bogus jobs report that added over 800K part-time jobs to the employment numbers. As with Justice Department concern over the "accuracy" of polls, "official" government numbers being adjusted with less than a month before the election is just a coincidence.