

The last time we took a look at the electoral math was just before convention season was about to get underway. Since it's now been over a week since the end of the Democratic National Convention, the effects of both parties' conventions are beginning to show up in the state-level polling. The news for the Obama team is good, almost across the board, as Romney showed little or no "bounce" from his convention, while Obama gained a significant bump after the Democrats' big party.
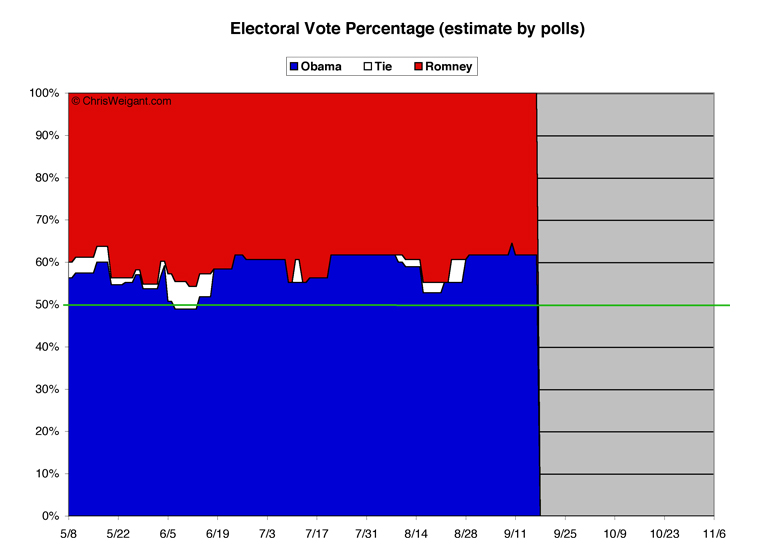
We'll get to specifics in a minute, but first here's the overview of how the race stands. Obama's electoral votes (henceforth "EV") start from the bottom and are measured in blue, and Romney's start from the top and are in red (ties are white, in the middle). If the polls are correct and the election were held today, here's how it would break down:
[Click on any of theses graphs to see larger-scale versions.]
Obama is staying pretty consistently above 60 percent on this chart, and even briefly spiked to 64.5 percent -- which would represent a two-to-one majority in the Electoral College. This is a marked improvement since the last time we took a look.
As the conventions rolled onwards, the amount of state-level polling increased, and from this point on the numbers should start coming fast and steady for the rest of the race (from the battleground states, at least). There was a lot of movement in the past few weeks, with a total of 13 states moving around within the categories. Seven of these wobbled from one category to another, but wound up where they started (Minnesota, Missouri, Montana, New Mexico, North Carolina, Ohio, and Virginia). Barack Obama lost ground in one state he held (Nevada) and gained ground in four (Florida, Iowa, Michigan, and Pennsylvania). Mitt Romney lost ground in one state he held (Arizona), and improved his position in none. Just on numbers alone, Obama saw a much better and bigger bounce than Romney, it's plain to see.
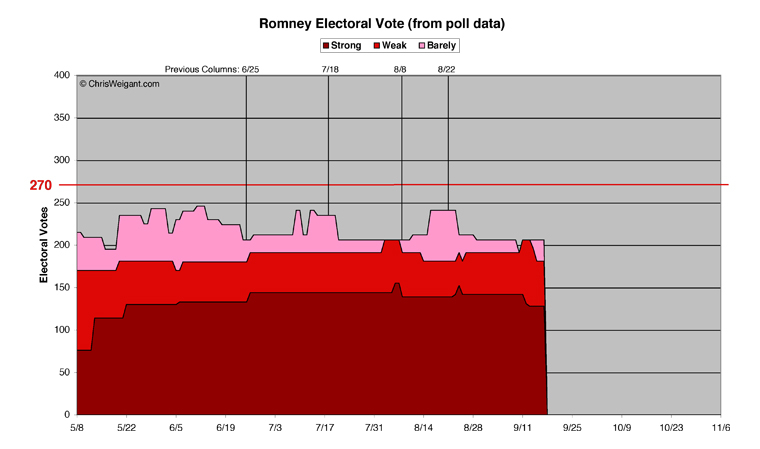
But let's do more than just scratch the surface, and delve into each candidate's standings. We begin with Mitt Romney's chart.
[Definition of terms: "Strong" means 10 percent or better in the polls,
"Weak" means 5 percent or better, and "Barely" is under 5 percent.]
From the previous vertical line (which marks when the last of these columns ran), Mitt's chart lines have been more lively than ever. He started this period off by losing Florida to Obama (the big falloff in the upper pink line), while gaining ground in Montana and Missouri. But then came the loss of Iowa to Obama's column, and Romney mostly stayed stable overall for the rest of this period. After briefly losing (and then regaining) North Carolina during the Charlotte Democratic convention, Romney appeared to strengthen his standing among the states in his column (when his "Barely" numbers disappeared). But this was soon followed by a weakening in both Arizona and Montana, dropping his "Strong" numbers at the end.
By the numbers, Romney started out the period with a total of 241 EV. By the end of the period, he was down to 206 EV (mostly due to losing Florida's 29 EV). In the crucial "Strong Plus Weak" number, Romney started at 181 EV, and then rose slowly to 206 (from his own convention bounce, small as it was). This is only the second time in the whole race Romney's topped 200 EV here, it should be mentioned. After Obama's bounce, however, this faded away and Romney ended up with the same 181 EV that he started with in "Strong Plus Weak." But even this was weaker, since Romney's Strong numbers fell from 139 EV to 128 EV.
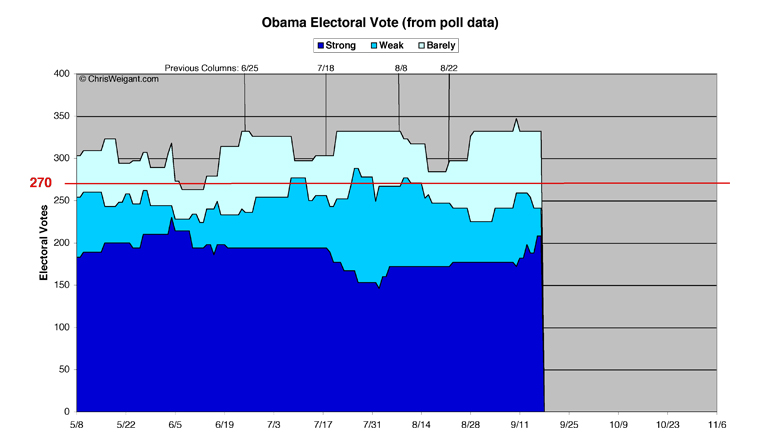
Which brings us to Obama's chart:
Obama's chart shows a slightly mixed picture, but one that is measurably more positive than before. Starting with our previous benchmark, Obama picked up Florida and Iowa, and briefly held North Carolina before it slipped back into Romney's column. Michigan briefly weakened for Obama, leading to a dip in the graph for Obama, but subsequently strengthened back up. Ohio and Virginia moved from Barely Obama to Weak Obama, but then moved back again. New Mexico and Minnesota moved from Weak to Strong, but also fell back again. Nevada fell back from Weak to Barely and stayed there. But the best news was at the end, when Michigan and Pennsylvania (and their total of 36 EV) moved from Weak Obama to Strong Obama, which shows up in the spike in the dark blue line, above.
Obama's total over this period rose from an already-impressive 297 EV all the way up to 347 EV -- a gain of 50 EV -- before falling back a bit to close at 332 EV. Bear in mind, he only needs 270 to win. Obama's Strong numbers also showed an impressive bounce, climbing from 172 EV at the start to finish at 208 EV. To put this in perspective, Obama now has more votes from states where he leads by over 10 percentage points than all of Romney's votes combined. That's a pretty good place to be, less than two months from election day. The only place Obama didn't show a convention bounce was in the Strong Plus Weak category, where he started at 247 EV, fell to 225, climbed to 259, only to slip back at the end to 241 EV -- six fewer than he started with. This translated to a drop in Obama's lead over Romney in the Strong Plus Weak numbers from 66 EV down to 60 EV.
If Obama's bounce dissipates, his numbers may fall back a bit next time around. But if Obama can build on his success, he could quite conceivably move a few battleground states from Barely to Weak, and improve his chances for success so drastically as to put the magic 270 EV number out of reach of the Romney team. It's still far too early to call the outcome in this fashion, but things are indeed looking good for Team Obama at this point.
My Picks
My picks rely more on gut feeling than on hard poll numbers, although this time around this is only really evident in the states which are very close right now. As always, we use slightly different category names here, to avoid confusion with the charts above. Full lists of the states in each category are provided at the end of the column.
Likely States -- Obama
Safe Obama (14 states, 179 EV)
No changes here, this time around. These 14 states are going to surprise nobody by voting for Obama this November.
Probable Obama (6 states, 62 EV)
One change here, which is about the only negative change for Obama. Nevada showed one weak poll, so I felt it was only fair to move it down from "Probable Obama" to "Lean Obama." I still think it'll firm up over time, so I would expect it to move back up here after a few more solid polls appear.
Likely States -- Romney
Safe Romney (17 states, 137 EV)
Romney loses one state from this category this time around, due to a weak poll in Arizona. However, the poll wasn't that weak, so Arizona only moves down to "Probable Romney" for now.
Probable Romney (5 states, 44 EV)
One addition here, as Arizona moves down. The other four states stayed stable for Romney.
Tossup States
Lean Obama (7 states, 91 EV)
This is where the action really was, in the past few weeks. Starting with the bad news, Nevada moved down here from Probable Obama, and Colorado and Ohio stayed put. Ohio could conceivably be on its way up to at least Probable Obama, as it seems to be slipping away from Romney's grasp, but I don't feel that level of confidence quite yet, so it spends another week being merely Lean Obama for now. The good news was four states moving up from "Too Close To Call" -- Florida, Iowa, Virginia, and Wisconsin. Now, as always, these states may move around again in future columns, but all four have shown consistently good (note: not "great," but "good") polling for Obama. Romney hasn't made inroads in any of them for quite a while, so all of them can now be seen as Lean Obama rather than true tossups.
Lean Romney (1 state, 10 EV)
Romney actually loses a state here, as North Carolina has to been seen as Too Close To Call at this point. Whether holding the Democratic National Convention in Charlotte will be enough to give Obama a shot here or not has yet to be seen, but it has been wavering away from Romney's camp enough to be seen as a real tossup at this point. Missouri should have been firmly in Romney's column by now, but the whole Akin controversy has kept the state remarkably soft for Romney, so it still can only be seen as Lean Romney, and nothing stronger.
Too Close To Call (1 state, 15 EV)
This category was all but cleaned out this time around, as Florida, Iowa, Virginia, and Wisconsin all moved up to Lean Obama. If North Carolina hadn't moved down from Lean Romney, the Too Close To Call category would be empty, in fact.
Final Tally
Adding up my picks shows how Obama's bounce may translate into an overwhelming advantage the closer we get to the election. Obama has 241 EV in the states he will likely win in November, while Mitt Romney only holds 181 EV. That's a pretty big edge right there. Out of the 116 EV in the Tossup states, Barack Obama needs 29 EV to push him over the finish line. Mitt Romney needs 89 EV to accomplish the same feat.
To put this in perspective, if Obama wins all his safe seats, all he needs is Florida to win a second term. Or, if he loses Florida, he can waltz back into office with only Virginia and Ohio. In either of these scenarios, it would not matter who won the following states: Colorado, Iowa, Missouri, Nevada, North Carolina, and Wisconsin. Romney, on the other hand, has to win all but a few of these battlegrounds in order to win the race. It's not an impossible task, but it certainly is much more of an uphill climb than what Obama faces at this point.
The big question in the next few weeks will be if Obama's impressive convention bounce will hold or fade away. This will set the stage for the first presidential debate, which could prove to be decisive. Since the race is speeding up, we will be looking at the electoral math much more frequently here, right up until the election itself.
[Electoral Vote Data:]
(State electoral votes are in parenthesis following each state's name. Washington D.C. is counted as a state)
Barack Obama Likely Easy Wins -- 20 States -- 241 Electoral Votes:
Safe States -- 14 States -- 179 Electoral Votes
California (55), Delaware (3), Hawaii (4), Illinois (20), Maine (4), Maryland (10), Massachusetts (11), New Jersey (14), New York (29), Oregon (7), Rhode Island (4), Vermont (3), Washington D.C. (3), Washington (12)
Probable States -- 6 States -- 62 Electoral Votes
Connecticut (7), Michigan (16), Minnesota (10), New Hampshire (4), New Mexico (5), Pennsylvania (20)
Mitt Romney Likely Easy Wins -- 22 States -- 181 Electoral Votes:
Safe States -- 17 States -- 137 Electoral Votes
Alabama (9), Alaska (3), Arkansas (6), Idaho (4), Kansas (6), Kentucky (8), Louisiana (8), Mississippi (6), Nebraska (5), North Dakota (3), Oklahoma (7), South Carolina (9), Tennessee (11), Texas (38), Utah (6), West Virginia (5), Wyoming (3)
Probable States -- 5 States -- 44 Electoral Votes
Arizona (11), Georgia (16), Indiana (11), Montana (3), South Dakota (3)
Tossup States -- 9 States -- 116 Electoral Votes:
Tossup States Leaning Obama -- 7 States -- 91 Electoral Votes
Colorado (9), Florida (29), Iowa (6), Nevada (6), Ohio (18), Virginia (13), Wisconsin (10)
Tossup States Leaning Romney -- 1 State -- 10 Electoral Votes
Missouri (10)
Too Close To Call -- 1 State -- 15 Electoral Votes
North Carolina (15)
Polled, but no polling data since the primaries:
(States which have not been polled since the beginning of June, with the dates of their last poll)
Maryland (5/21), Nebraska (5/16), Rhode Island (2/22), South Carolina (1/13), Tennessee (5/9), and Texas (5/13).
No polling data at all, yet:
(States which have not been polled so far this year)
Alaska, Arkansas, Delaware, Hawaii, Idaho, Kansas, Louisiana, Mississippi, Washington D.C., Wyoming
Electoral Math Column Series Archive:
Chris Weigant blogs at:
Follow Chris on Twitter: @ChrisWeigant
Become a fan of Chris on The Huffington Post