
Remarkable Stability
President Obama just had his most stable month ever in the public opinion polls. This month also caps off a truly remarkable year of polling stability for Obama.
Of course, were you to just read the headlines or listen to the soundbites on television, you may have a different impression. "Obama's poll numbers tanking!" seems to be the conventional stupidity (I just can't bring myself to call such nonsense "wisdom" even with a qualifier) parroted in the media for roughly the past year.
True, Obama's poll numbers did "tank" in 2009, but since then they have neither dropped precipitously nor recovered -- they have remained fairly stable. Which is the story pretty much everyone has been missing.
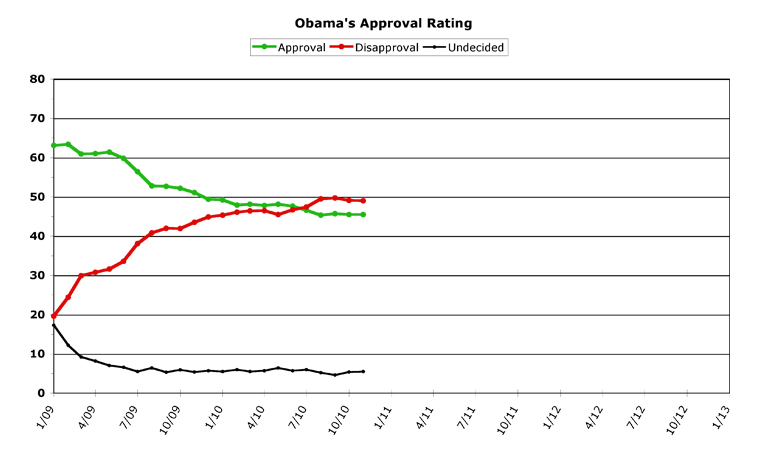
Before we get to all of that in more detail, let's take a look at the updated chart for Obama:
[Click on graph to see larger-scale version.]
November, 2010
November began with (in his own words) a "shellacking" at the ballot box for President Obama's party. Again, a story the entire media universe missed was that this did not budge his approval rating among the public one bit. Surprised? It's no wonder, with all the talk of the election being a massive "rejection" of Obama and all that he stood for.
All month long, news trickled out that the "bailouts" were working, although this news was never really articulated by Democrats much and woven into a (mostly non-existent) political narrative, so not many folks noticed. GM is well on its way to recovery and paying back their bailout money, and even TARP may eventually break even -- with all (or, at the least, over 95 percent) of the money repaid. As I said, though, Democrats failed mostly to capitalize on this news... as usual. Obama did trumpet the GM news a bit, to his credit.
Nancy Pelosi surprised everyone by announcing that rumors of her stepping down as House Democratic leader were not to be believed, but the White House stayed out of this political fracas, so it didn't really reflect on Obama much one way or the other.
Obama's Deficit Commission co-chairs announced a draft of the plan they were hoping to come up with, but this merely signified that no plan was likely to get the necessary 14 of 18 votes from the commission. Few Democrats had anything nice to say about the plan, and as the month closed it became apparent that the Commission wasn't going to be able to agree on much of anything.
Republicans have been fairly quiet over the past month, as they deal with their own inside-the-party squabbles over what to do now that they're going to hold one house of Congress next year. At the end of the month, they did finally muster up the political courage to meet with the president, which happened without any real fireworks (or actual progress on any of the issues).
Obama has been using his bully pulpit to push an issue he might not win on -- the "New START" strategic arms reduction treaty. Being a treaty, it cannot be either amended or filibustered in the Senate -- but it also requires a daunting 67 votes for ratification. Meaning Obama's going to need a double-handful of Republicans to vote for it. Republican Senator Jon Kyl has been leading the fight against the treaty, for ever-more-obscure reasons (and for his own species of kickback in the military budget). Obama, so far, has been resolute on pushing a vote on the treaty, and by doing so has painted Republicans into the "you're delaying national security for partisan reasons" corner, so it'll be interesting to see how this all works out.
And finally, the lame duck Congress is back in town, but didn't accomplish much before the end of November -- but will be big news in the coming month.
Throughout the entire month, President Obama's approval rating did not change one tiny bit. It remained at 45.5 percent, exactly the number he posted in October. This is the first time this has happened in his presidency, although statistically it is no more significant than posting small changes of less than a half percent (which he's done numerous times before). The remarkable thing, however, is that in the same month, his disapproval rate also remained essentially unchanged -- and actually got better by a tenth of a percent -- to end up at 49.0 percent for the month. Taken together, this is the smallest aggregate change in ratings Obama has ever posted. In other words, the month was remarkably stable for the president's approval ratings.
Overall Trends
Not only were Obama's final numbers for the month remarkably stable, but his numbers within the month were also about as close to a flat line as you can get. Obama began the month at 46.0 percent approval, fell in the second week to 44.9 percent, then quickly rose to 46.0 percent again. Obama finished the month with a smaller version of this cycle, falling to 45.4 and then closing the month out at 45.9 percent -- virtually unchanged from the first day of the month. In November, Obama's daily approval rate only fluctuated a tiny 1.1 percent, in other words. This was the smallest rate of fluctuation Obama has ever posted.
Obama's disapproval rate fluctuated a bit more -- but not much. Obama started the month at 49.0 percent disapproval, which quickly rose to 50.0 percent, but then fell back in the latter part of the month to a low of 48.0 percent. This climbed slightly to finish the month at 49.3 percent -- again, almost exactly where it had begun the month. For the entire month, Obama's disapproval rate only fluctuated a total of 2.0 percent. Obama's final average for November was 49.0 percent -- a one-tenth point gain from October, and the second straight month of gains for Obama in this category. Obama has only lowered his monthly average disapproval a total of four times in his entire presidency, and two of them have been in the past two months, to put it another way.
Even more significantly, for the first month in a long time, Obama posted no all-time high marks, either in daily polling or monthly averages. His lowest all-time monthly approval happened in August this year, and he's posted better numbers in the three months since. His highest all-time monthly disapproval happened in September, and has since fallen for two straight months. Obama posted no all-time records in daily numbers, either, for the first time in a long time.
Part of the explanation for the flatness of Obama's numbers could stem from a certain lull in polling around Thanksgiving. But, even with this gap, Obama has shown remarkable consistency throughout the month.
Which brings us to the bigger picture of "How flat is flat?" Feel free to insert your own "flatline" or "Flatland" joke here (although we strongly frown on juvenile and misogynistic humor, so don't even go there, please).
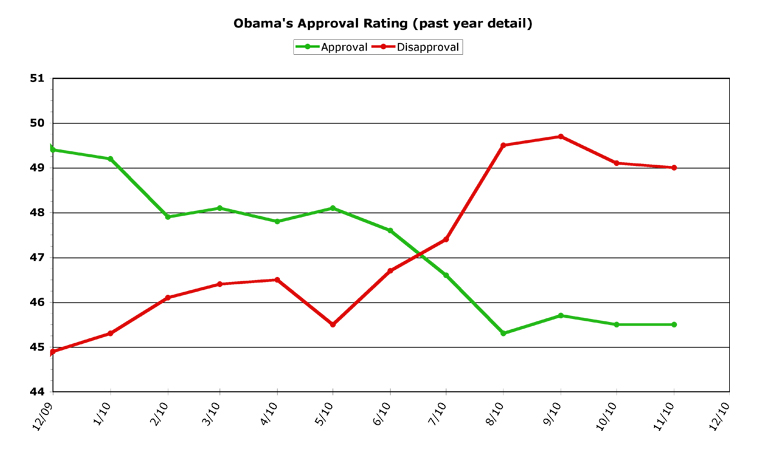
The only way to answer this question is to put things in perspective and attempt to expand the flatness in some sort of context. To do so, I've taken the past twelve months of the above graph, and expanded the heck out of the vertical scale. This graph shows President Obama's poll numbers for the past year, under a magnifying glass:
[Click on graph to see larger-scale version.]
Even when we expand the original graph's scale more than tenfold, periods of flatness still can be seen. In early 2010, Obama flirted with 48 percent approval for four months, and the same sort of plateau is seen in the past four months as well. Obama's disapproval line is a bit less flat on this scale, but recently has shown signs of flattening out as well, if not actually falling back.
True, the overall trend for Obama has been downhill approval-wise and uphill disapproval-wise. But the striking thing to me is how stable even this trend has been. In an entire year, the absolute difference between Obama's approval rate and his disapproval rate has stayed at less than five percent. Last December was his high point, at a 4.5 percent positive difference. This August was his low point, with a 4.2 percent negative difference of opinion. Since August, this gap has been closing every month, until it now stands at 3.5 percent negative.
That is remarkably stable.
To put all these figures into words, first consider the year we are talking about. Last December was the first big showdown on health-care reform in the Senate. This dominated the political debate for months, until it was finally signed into law. Next came Wall Street reform -- a more esoteric issue, but an important one as well. In the midst of all this was the BP oil well disaster in the Gulf. Then we had a brutal midterm election season. Throughout all of this (and many other contentious battles I didn't even bother mentioning), virtually the entire country did not budge in their assessment of how Obama was doing his job. 90 percent of the populace either continued to approve or disapprove of the job Obama was doing. Another five percent were consistently "undecided." Only five percent -- one person in twenty -- had a changing opinion on Obama at all. This five percent started off approving of Obama, then switched to disapproval, and are now possibly beginning to register some approval for Obama once again.
Remarkably, remarkably stable. Which you simply would not be aware of, if all you had to go on was the mainstream media, I point out once again.
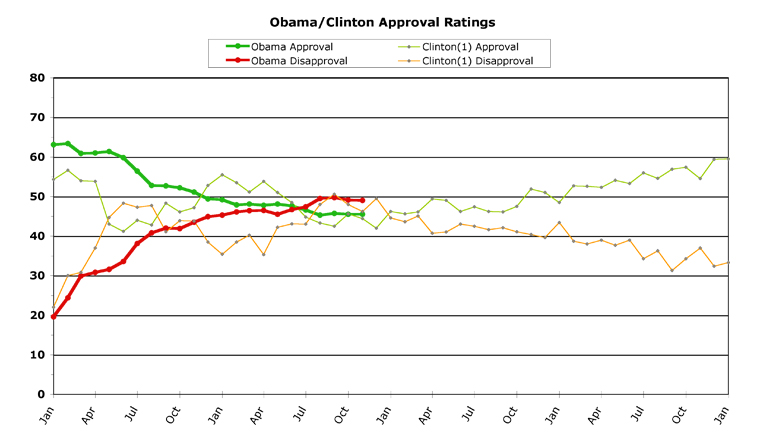
To put this in even further perspective, compare Obama's record to Bill Clinton's first term. At the end of October (in other words, midterm election time), Obama and Clinton were almost exactly at the same point in both approval and disapproval:
[Click on graph to see larger-scale version.]
But look at the fluctuation in Clinton's lines, compared to Obama's. In the same period we just examined for Obama above (the past year), Clinton's approval fluctuated a full 13 percent. His disapproval fluctuated even more -- a whopping 15.3 percent -- in the same time period. Obama's numbers, by comparison, were a range of 4.1 percent for approval and 4.8 percent for disapproval.
Of course, the flat nature of Obama's lines for the past few months make it tough to predict what is around the corner for him. December could be a very productive month for the president, if he can manage to shepherd some significant legislation through the lame duck Congress. He's certainly got no shortage of issues to choose from, in addition to the "New START" treaty he has already thrown his weight behind. But it could just as easily become a very disappointing month, as Republicans do what they do best, which is to block absolutely everything from happening.
Historically, Obama has these plateaus and then goes into a further slide in approval, I hasten to point out. This could prove to be the case this time as well. But there is also the hint of a possibility that Obama has hit a low point and is clawing his way back upwards. Continued improvement in the economy would certainly help him out in general public opinion, so the next few months of economic indicators will be crucial (beginning this Friday with the release of the new unemployment numbers).
Much depends on the next few weeks, and the productivity of the lame duck Congress. Much also depends on how Obama is seen by the public during this period as well -- whether he is seen as leading or not, in other words, no matter what the outcome in Congress.
Of course, there's a third option as well. Obama's approval ratings could remain... well... remarkable stable, and not move much in any direction at all.
[Obama Poll Watch Data:]
Column Archives
[Oct 10], [Sep 10], [Aug 10], [Jul 10], [Jun 10], [May 10], [Apr 10], [Mar 10], [Feb 10], [Jan 10], [Dec 09], [Nov 09], [Oct 09], [Sep 09], [Aug 09], [Jul 09], [Jun 09], [May 09], [Apr 09], [Mar 09]
Obama's All-Time Statistics
Monthly
Highest Monthly Approval -- 2/09 -- 63.4%
Lowest Monthly Approval -- 8/10 -- 45.3%
Highest Monthly Disapproval -- 9/10 -- 49.7%
Lowest Monthly Disapproval -- 1/09 -- 19.6%
Daily
Highest Daily Approval -- 2/15/09 -- 65.5%
Lowest Daily Approval -- 10/17/10 -- 44.2%
Highest Daily Disapproval -- 9/26/10 -- 51.2%
Lowest Daily Disapproval -- 1/29/09 -- 19.3%
Obama's Raw Monthly Data
[All-time high in bold, all-time low underlined.]
Month -- (Approval / Disapproval / Undecided)
11/10 -- 45.5 / 49.0 / 5.5
10/10 -- 45.5 / 49.1 / 5.4
09/10 -- 45.7 / 49.7 / 4.6
08/10 -- 45.3 / 49.5 / 5.2
07/10 -- 46.6 / 47.4 / 6.0
06/10 -- 47.6 / 46.7 / 5.7
05/10 -- 48.1 / 45.5 / 6.4
04/10 -- 47.8 / 46.5 / 5.7
03/10 -- 48.1 / 46.4 / 5.5
02/10 -- 47.9 / 46.1 / 6.0
01/10 -- 49.2 / 45.3 / 5.5
12/09 -- 49.4 / 44.9 / 5.7
11/09 -- 51.1 / 43.5 / 5.4
10/09 -- 52.2 / 41.9 / 5.9
09/09 -- 52.7 / 42.0 / 5.3
08/09 -- 52.8 / 40.8 / 6.4
07/09 -- 56.4 / 38.1 / 5.5
06/09 -- 59.8 / 33.6 / 6.6
05/09 -- 61.4 / 31.6 / 7.0
04/09 -- 61.0 / 30.8 / 8.2
03/09 -- 60.9 / 29.9 / 9.2
02/09 -- 63.4 / 24.4 / 12.2
01/09 -- 63.1 / 19.6 / 17.3
ObamaPollWatch site:
Chris Weigant blogs at:
Follow Chris on Twitter: @ChrisWeigant