

As a new month dawns with Al Franken still not seated in the Senate...
No, wait, that's not what I wanted to start with. Let me try again.
As a new month dawns, it is time once again to take a look at President Barack Obama's poll numbers. We kicked off this column series last month, and will be returning at the beginning of every month throughout Obama's term as president to take a snapshot of his approval ratings in the polls. This month, as an added feature, we will also be looking at Obama's poll numbers as compared to Bill Clinton's poll numbers from his first term.
Now, if you're one of those who just hates or distrusts polling in general, then I would advise you to stop reading right now, because the rest of this column is only going to annoy you. Fair warning.
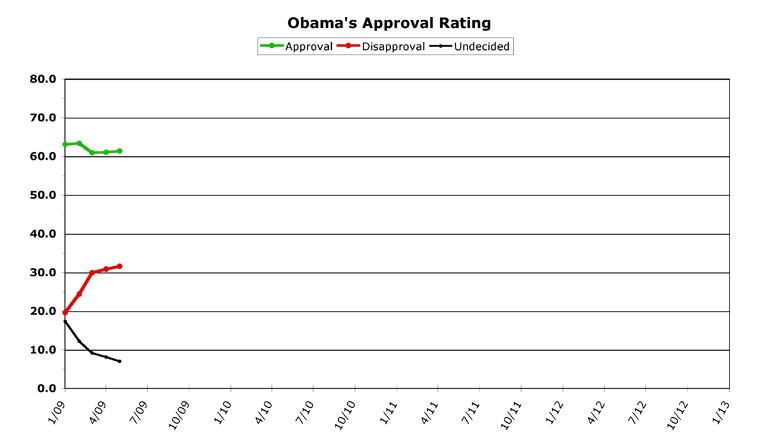
For everyone still reading, let's get right to the charts. Beginning with, of course, Barack Obama's approval graph.
[Click on the graph to see a larger version of it.]
Overall, a pretty steady and strong approval rate. Let's look at what this month's numbers have to say about the public's approval for Obama's term so far. As always, the raw data comes from RealClearPolitics.com (specifically, their daily Obama approval rating numbers page). For a discussion of why I chose these numbers over others, and other methodology explanations, see last month's column. Full numeric data can be found at the end of this article, for true wonks to peruse.
May 2009
Obama had his ups and downs in May, taking on contentious issues from the left and from the right. A high point for him (as with any president) was getting to name his first candidate for Supreme Court Associate Justice. While the economy wasn't exactly roaring along, it did seem to have halted the free fall it was in when Obama took office. And the public, with a much longer attention span than the mainstream media, took it all in stride. Or perhaps Obama is just enjoying an extended honeymoon period, where all incoming presidents are given the benefit of the doubt by the public.
But what does stand out is how solid Obama's numbers are. There is very little movement in them all month, mostly what would be considered within the margin of error of the polls themselves. For the month, Obama wound up with an average of 61.4 percent approval and 31.6 percent disapproval. His approval rate inched up four-tenths of a point from last month, and his disapproval was up eight-tenths of a percent. This led to the lowest undecided number yet for Obama, at 7.0 percent -- a continuation of the trend of fence-sitters making up their minds about him, one assumes.
Obama hit his daily high early in the month, at 62.5 percent on the fifth of May. His low point for the month was 60.7, from May 21 (and, later, May 28-29). His disapproval rate started low, at 30.4 percent, but climbed in the second half of the month to hit an all-time high of 32.8 just before month's end.
Overall Trends
The stability of Obama's numbers (especially the approval rating) continued in May, which (as we're about to examine) is remarkable compared to other presidents during the same time period in their terms. The total spread of Obama's monthly approval averages for his term so far is only 2.5 percent -- impressively stable. His disapproval ratings have swung a full twelve points upward in the same time period, but as honeymoon periods go, this still isn't all that bad. The trend for the disapproval line on the graph shows that his disapproval numbers have ended their sharp upward slope, and are leveling off at slightly more than thirty percent. But this month, Obama slightly gained in both approval and disapproval, as more people made up their minds about him.
Obama v. Clinton
To put this in some sort of historical context, let's take a look at Bill Clinton's first term for comparison. I'd like to thank the helpful people over at Pollster.com for aiding me in finding raw data to create these historical charts. It takes a lot of number crunching to create these charts, so we'll be rolling out presidents one by one, over the next few months. Next month we'll take a look at Clinton's second term (in which his polls were a lot better than his first), and after that we'll delve into George W. Bush's approval ratings.
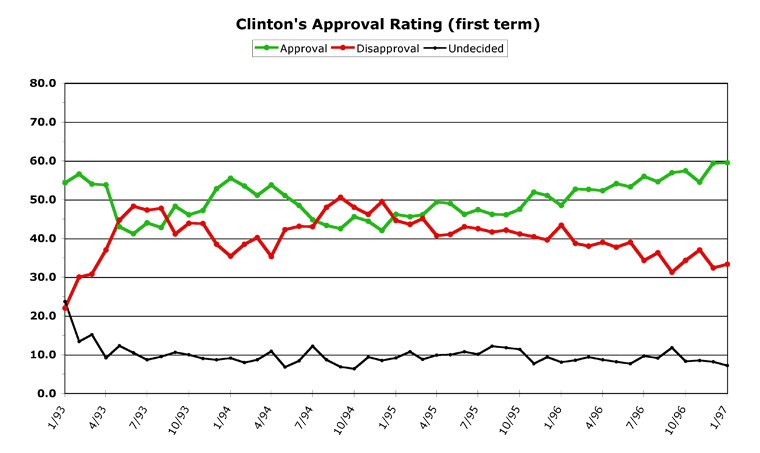
But to begin, here is the chart for Clinton's first term:
[Click on the graph to see a larger version of it.]
Bill Clinton, after a brief honeymoon period, struggled in the polls throughout the rest of his first term. Getting over the magic 50 percent level of approval was tough for Clinton, and he really didn't seem to enjoy smooth sailing until the last year of his first term, when he was running for re-election.
At this point in his first term, Clinton had just had a sharp dive in the polls, resulting for the first time in his disapproval numbers being higher than his approval numbers. This is a serious warning sign for anyone who holds political office, and would return for Clinton at the end of 1994.
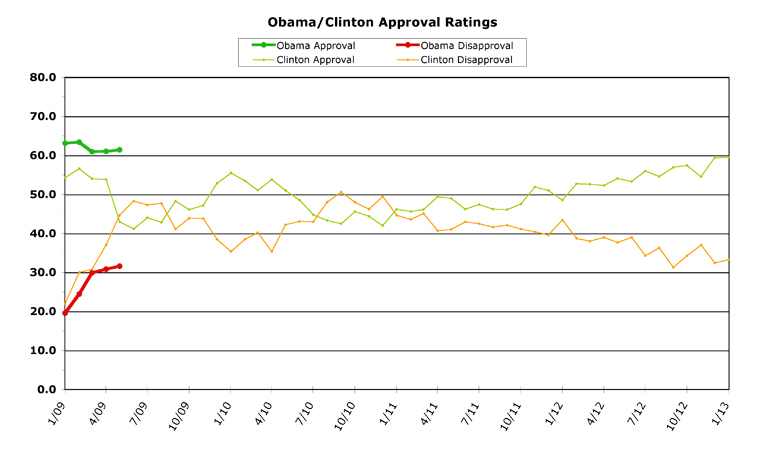
To see the difference in Clinton's graph and Obama's current numbers, let's put them both on a single graph. [Editor's note: Please let us know if you have problems reading Clinton's lines on this graph -- this is the first time we've done this, so let us know if improvement is needed.]
[Click on the graph to see a larger version of it.]
Barack Obama, compared to Bill Clinton, is doing better at the beginning than Clinton managed his whole first term in office. Clinton never got above 60 percent in his first four years (he finished at 59.5 percent, the closest he managed). Obama has not been below 60 percent yet. Part of this is due to the election both men won, and how they won it. Clinton was in a three-way race, where H. Ross Perot won almost 20 percent of the popular vote. Obama won over half of the popular vote in an electoral landslide -- something Clinton didn't manage to do either time he won, which led to charges that he "didn't have a mandate," which weakened him politically. Obama does not have this problem, and is following one of the least-liked presidents in American history. So part of Obama's advantage is due to the nature of how he took office as opposed to how Clinton got there.
But while this month was disastrous for Clinton, who ended up with only 43.0 percent approval, Obama shows more staying power. Now, this doesn't mean that Obama's honeymoon is never going to end -- I've said all along that Obama will eventually face worse poll numbers than he enjoys currently. And Obama's eventual dropoff could be just as severe as what Clinton saw at this point in his term. There still aren't a lot of data points on the graph for Obama, so I caution everyone not to make sweeping statements based on only a few months.
Having said that, though, Obama should indeed take heart in how he's stacking up against the most recent Democrat to hold the White House. And at how rock-steady his approval rating has been throughout this time period. Obama has a lot of issues on his plate, and has made some decisions which have enraged both the hard right and the hard left in dealing with these issues. But the public at large quite obviously trusts Obama better than they trust his critics from either the left, the right, or the media. If he can keep holding this reservoir of public support, Obama will wind up getting a lot more done than anyone could have reasonably expected in Washington.
[Note: This series is a work in progress. What do you think so far? Do the charts need improvement? Are they hard to read, or easy to understand? Let me know in the comments, or drop me an email. We aim to please.]
[Obama Poll Watch Data:]
Obama Poll Watch column archive:
[Apr 09]
Obama's All-Time Statistics
Highest Monthly Approval -- 2/09 -- 63.4%
Lowest Monthly Approval -- 3/09 -- 60.9%
Highest Monthly Disapproval -- 5/09 -- 31.6%
Lowest Monthly Disapproval -- 1/09 -- 19.6%
Highest Daily Approval -- 2/15/09 -- 65.5%
Lowest Daily Approval -- 3/4/09 -- 59.8%
Highest Daily Disapproval -- 5/28/09 -- 32.8%
Lowest Daily Disapproval -- 1/29/09 -- 19.3%
Obama's Raw Monthly Data
[All-time high in bold, all-time low underlined.]
Month -- (Approval / Disapproval / Undecided)
05/09 -- 61.4 / 31.6 / 7.0
04/09 -- 61.0 / 30.8 / 8.1
03/09 -- 60.9 / 29.9 / 9.1
02/09 -- 63.4 / 24.4 / 12.2
01/09 -- 63.1 / 19.6 / 17.3
Chris Weigant blogs at: ChrisWeigant.com