
As October dawns (well, actually, we're more into mid-morning October, as it were -- see Program Note, below -- perhaps "as October gets underway," that's better) it's time again to take our monthly look back to see how President Obama is doing in the opinion polls. This month, the news for Obama fans is not bad. It's not get-up-and-cheer good, either, but it's a lot better than the news has been for the past two months.
I say this because Obama has stopped his slide in the polls. The downward slope of his approval numbers came to a screeching halt, and instead began hovering above (but never dipping below) the 50 percent mark. Since then, they have wavered in the 50-55 point range -- not trending clearly upwards, but at least not trending clearly downwards, either. Better news for Obama fans is the fact that his disapproval numbers actually did reverse course after hitting a mid-month peak, and have settled downwards from that point on.
After we look at these trends in a bit of detail, we continue our trip through the past, focusing this month on George Herbert Walker Bush, and how his poll numbers compare to Obama's.
Of course, you can continue tracking our past presidential comparisons (for, so far: G.W. Bush, Bill Clinton, and G.H.W. Bush) with fun and up-to-date graphs, over at our ObamaPollWatch.com page.
But enough shameless self-promotion, let's get on to the charts!
[Click on graph to see larger-scale version.]
September 2009
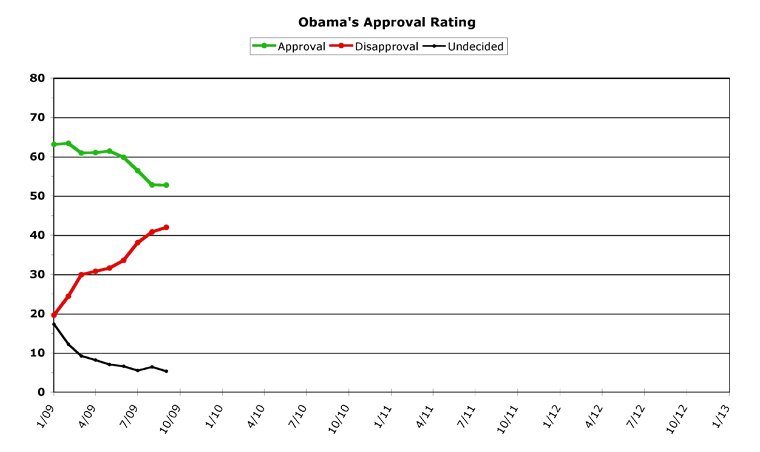
As I said, that's a better chart to look at for Obamaphiles than the past few months. Holding even is better than going downwards. Going up would be better still, but that may remain elusive for Obama until he actually signs a health care reform bill.
Obama started off the month of September in stark contrast to his opposition. He gave a speech to school children, and the far right howled: "Indoctrination!" Middle-class and independent voters saw this as a bit unseemly. Then Obama gave a rousing speech to a joint session of Congress on health care reform, and a Republican shouted out "You lie!" during his speech. This was the natural end to the town hall ferocity of August. But Obama's critics have seemingly gone too far in their naked disrespect and disdain of our duly-elected president (the recent cheering of the right over the loss of the Olympics drove this disrespect straight into the swamp of anti-Americanism... and middle class voters are taking note). Because this is precisely the point where Obama turned his poll numbers around.
For the rest of the month, slow progress was made by Max Baucus' committee on actually producing a health care reform bill, which destroyed the media's inside-the-Beltway wisdom (which they've been trying desperately to feed us for months now) that "health care reform is dead for this year." Coming up this month: the destruction of the media's inside-the-Beltway storyline that "the Senate Finance Committee runs the entire United States government," as they are all astonished to find out that there are four other competing bills. But we're getting ahead of ourselves. For now, the best news is that nobody (in the media or in the White House) seems interested in the word "bipartisan" any more. This is good news indeed, if you'd like to see some sort of health care bill passed this year.
Foreign-policy-wise, Obama scrapped Bush's ridiculously provocative "Star Wars" missile defense in Eastern Europe, and in exchange got the Russians on board with putting the screws to Iran. The talks between Iran and the U.S. later showed more progress in one day (as a direct result of Russia's pressure, no doubt) than in the past eight years. The failure of Chicago's Olympics bid happened after the month closed, so its effect (if any) will show up next month.
Let's take a quick overview of the numbers this month, and then move on to identifying what they mean and their overall trends. Barack Obama's approval numbers this month almost completely stopped the slide they've been experiencing since June -- but not totally, as they were down a tiny tenth of a percent to 52.7 percent. But 0.1 percent down is good news indeed because it followed losses of 1.6 percent (June), 3.4 percent (July), and 3.6 percent (August). And if the last few days of September had been just slightly better in the daily poll averages, Obama would have remained exactly even. But the real good news is actually hidden, since one number per month can't accurately show intra-month trends. Obama's disapproval overall for the month was up (as it has been every month since he took office) 1.2 percent, to 42.0 percent for September. But for the first time, Obama has a good chance of reversing both trends next month.
Overall Trends
Technically, Obama continued his trend of getting worse this month, when you look at only the chart above. Once again, his approval numbers hit their all-time low this month, and his disapproval numbers hit their all-time high.
But once you look at the daily numbers, you see a real turnaround. For the past four months, Obama's approval numbers have followed a slide within the month as well. His high for the month would come very early in the month (the first week), and his low for the month would happen at the very end of the month. This month was not a complete reversal of this trend, but a partial one which shows signs of encouragement. Obama hit his approval low point on the first day of the month, at 51.5 percent, and then rose to his high point of 53.6 percent on the 21st day of the month. But this gain was not steady, but rather bounced around a bit, and he ended the month down a bit, at 52.5 percent. But still -- this is the first month since April that Obama closed better than he opened.
This was even more noticeable in his disapproval rate. Obama started the month at 43.8 percent, which fluctuated a bit and then hit a high of 44.0 percent on the 13th of September. Since this point, the numbers fell a whopping 3.5 points to close the month at a low of 40.5 percent. Once again, this is the first time this has happened since April. But although Obama's disapproval may have already peaked for now, such subtle movements don't show up in the monthly numbers for a while, so his monthly data point (being an average) is still up for this month. Both of these trends can be seen in more detail at the daily poll-of-polls graph over at RealClearPolitics, where we get our data from.
[Click on graph to see larger-scale version.]
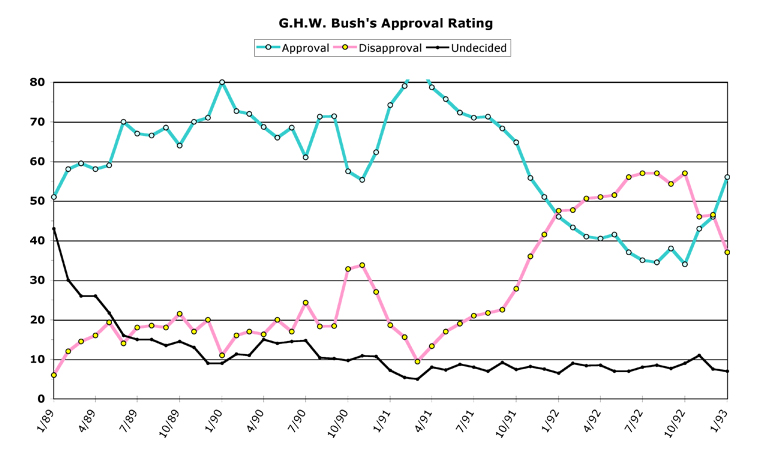
Bush started his term at record highs, due to the leftover warm feelings for Reagan. President Ronald Reagan (whom we'll examine next month) was somewhat tarnished towards the end by his admission that the Iran-Contra scandal actually had some fire (and not just smoke, as he had claimed earlier), but by the very end of his term he had bounced back from this.
Bush benefited from two events which took place during the early part of his term -- the collapse of the Soviet Union, and the fall of the Berlin Wall. The Berlin Wall began to come down at the beginning of November, 1989, which you can see drove Bush's approval up to an early peak of 80 percent. The second, even-greater peak happened during the Gulf War, which happened after Saddam Hussein invaded Kuwait. Other than his first month in office, Bush didn't fall below 55 percent until his re-election campaign began in earnest -- an astonishing feat for any president.
Bush's extremely impressive numbers caused a number of prominent Democrats to decide to sit out the 1992 presidential election. "Bush is going to get re-elected," they figured, "so why bother -- I'll wait until '96." But Bush ran into a brick wall before he got to the election -- this was the year of "it's the economy, stupid," if you'll recall. Bush broke his "no new taxes" pledge to Republicans, which outraged many in his party, plus he had to contend with the strongest third-party bid in generations (H. Ross Perot took 19 percent of the popular vote). All of this combined to send Bush's approval ratings down to the mid-30s during the election itself. He did, at the very end, receive the same sort of bounce in the polls which almost every president gets on his way out of office (even Bush's son went up in the polls at the very end, although not as much as his father did).
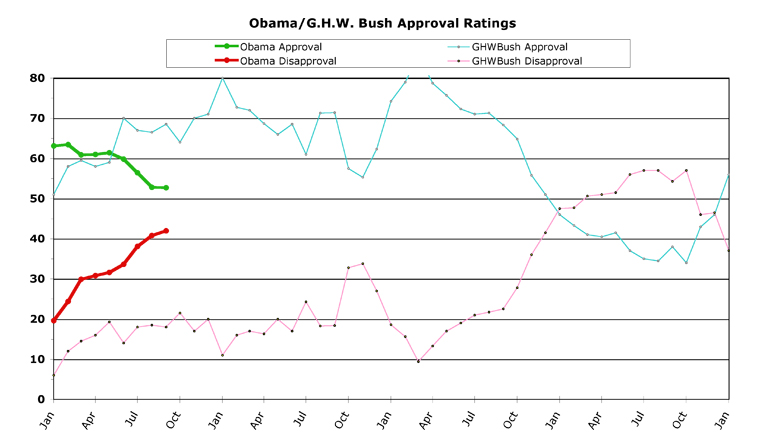
Barack Obama's numbers don't look all that great when stacked up against George H.W. Bush's (so far, at least):
[Click on graph to see larger-scale version.]
The lesson to be drawn from George H.W. Bush is that it's virtually impossible to predict what is going to happen in any election until you actually get there. Bush had truly astronomical numbers for his first three years -- so much so that he was considered "invincible" in 1992. During this time, his disapproval numbers averaged around 20 percent, and only got above 30 percent for one two-month period. His approval numbers didn't fall below 55 percent during this entire period as well, and averaged closer to 70 percent.
Those are some pretty good numbers. In fact, those are incredible numbers for any president to have. Which is why he looked unbeatable, in the crucial period when politicians were deciding whether or not to run.
But what a difference a year makes. By the election, Bush had hit his low point in the polls, and lost to Bill Clinton.
The moral of this story is: it doesn't matter where the polls are one year out, literally anything -- good or bad -- can happen between now and an upcoming election. This lesson, incidentally, has been completely ignored by the media mavens who are already feverishly handicapping next year's midterms (and, incidentally, predicting massive losses for the Democratic Party). Remember, guys, anything can happen. We've got a whole year to go.
[Program Note: Due to a quirk in the calendar, we're getting to the ObamaPollWatch column a bit late this month. Much like calculating Easter (except, for this column's purposes, the full moon has no bearing on when it appears -- although, upon reflection, it may occasionally influence the content... ahem), it's not as easy as it looks. Because Fridays already have their own column series, this column will always appear on the first Monday or Wednesday which follows the end of a month. If I'm really, really on top of it, I can sometimes get it out on the last day of the month. Sadly, this month, this was not to be. So, because the month ended last Wednesday, and because the charts I have to create each month are multiplying, we're well into October. Apologies for the delay.]
[Obama Poll Watch Data:]
Column Archives
Obama's All-Time Statistics
Monthly
Highest Monthly Approval -- 2/09 -- 63.4%
Lowest Monthly Approval -- 9/09 -- 52.7%
Highest Monthly Disapproval -- 9/09 -- 42.0%
Lowest Monthly Disapproval -- 1/09 -- 19.6%
Daily
Highest Daily Approval -- 2/15/09 -- 65.5%
Lowest Daily Approval -- 8/20/09 -- 51.2%
Highest Daily Disapproval -- 9/13/09 -- 44.0%
Lowest Daily Disapproval -- 1/29/09 -- 19.3%
Obama's Raw Monthly Data
[All-time high in bold, all-time low underlined.]
Month -- (Approval / Disapproval / Undecided)
09/09 -- 52.7 / 42.0 / 5.3
08/09 -- 52.8 / 40.8 / 6.4
07/09 -- 56.4 / 38.1 / 5.5
06/09 -- 59.8 / 33.6 / 6.6
05/09 -- 61.4 / 31.6 / 7.0
04/09 -- 61.0 / 30.8 / 8.2
03/09 -- 60.9 / 29.9 / 9.2
02/09 -- 63.4 / 24.4 / 12.2
01/09 -- 63.1 / 19.6 / 17.3
Questions or comments? Use the Email Chris page to drop me a note.
Chris Weigant blogs at: ChrisWeigant.com