
 If you're like me, I have my favorite nonprofits that I donate to frequently. Every year they send me their annual report filled with pretty pie charts, graphs and numbers saying that they helped tons of people because I gave generously to their cause.
But I think about this. How do I know if I actually invested in a solution to the problem? How do I know my donor dollars changed people's lives beyond the year that the annual report was published?
Chances are, if the internal staff of a nonprofit is reflecting on the same barrage of point-in-time data that it is delivering to donors then there's little understanding of whether the investments of 2010 are still paying off in 2013. Organizations rely too much on "reports" -- generally long, written documents -- that provide minimal opportunity for organizations to create engagement with stakeholders and their contribution to the results. Nobody reads them and few can understand them.
It's what we like to call "Data Puke"; loads of data absent real insight. It makes everyone feel good because there are more numbers than you can possibly comprehend.
Today, reports don't mean much just by themselves. In my work with the international nonprofit Water For People, we know that many organizations are stuck in the idea that simply increasing access to water at a moment in time will actually alleviate the situation. It's sadly "temporary" problem solving. What happens when the pump breaks, or when babies are born into the community and the system needs expansion, or when a cyclone passes through and pummels the water distribution system and it needs repair?
Water For People has lived through projects that didn't work, that didn't survive. We've learned to think bigger -- to stop focusing on individual projects and instead look at the capabilities of governments and entire districts around the world to engage in transformative change so that everyone has access to water that lasts forever.
We think the only way to achieve this is to diligently track year-over-year progress. Did the 2012 decision to train more mobile mechanics to fix pumps enable those pumps to still be working in 2016? Did we reach Everyone in 2013 only for water to stop flowing for people in the district five years later?
These are trends we can't ignore.
Re-Imagine Reporting Home Page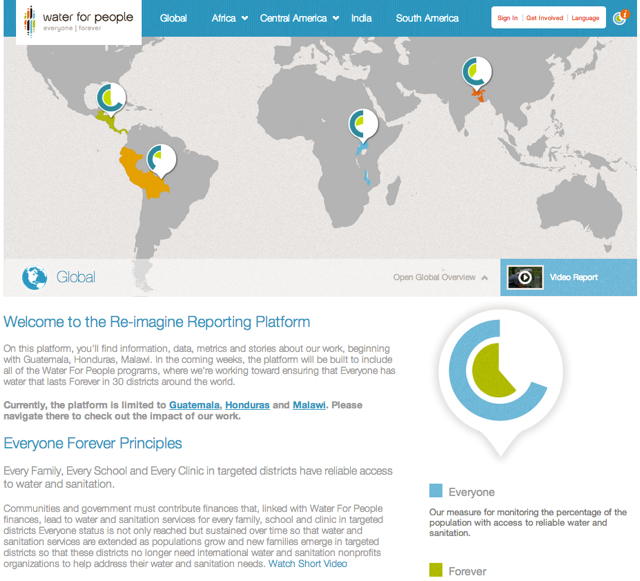
The Re-Imagine Reporting global page displays "Everyone Forever pins" that quickly illustrate the status of the areas where Water For People works to reach Everyone with access to water that lasts Forever
That's why we launched our Re-Imagine Reporting platform. Designed and developed by EffectiveUI, a leading user experience agency, it's a new approach to reporting that provides an interactive window into our progress over time. We're grateful that the Case Foundation took an early interest in the idea, provided start-up funding, as well as their visionary guidance and connections to many organizations that contributed their insights.
It's been a wonderful journey on this project that involved dozens of people, beginning with the Skoll Foundation that helped us envision the platform in early 2012. We released a prototype in August 2012, at World Water Week in Stockholm, Sweden. We launched the beta version of Re-Imagine Reporting this March at a special event called GoodxGlobal in Austin, Texas, during SXSW Interactive. We were even nominated for an Activism award.
Re-Imagine Reporting vastly changes how we visualize our monitoring results to drive our decisions year after year. It combines all of our data in one place, helping us understand what is happening and what changes in investment might lead to greater impact with our country programs. Supporters and the general public will clearly see the status of our work with compelling data infographics as well as "The Story" depicted in videos, articles, and social media. You can see how our investments are leveraged to go further and deeply engage governments and districts as active participants in developing and owning their water and sanitation solutions.
Re-Imagine Reporting fundamentally increases our ability to evaluate programs and make decisions based on trends and feedback from partners. It allows us to more clearly see our results and quantify investments to reflect our successes but more importantly also highlight ways that we can constantly improve.
Re-Imagine Reporting Honduras Page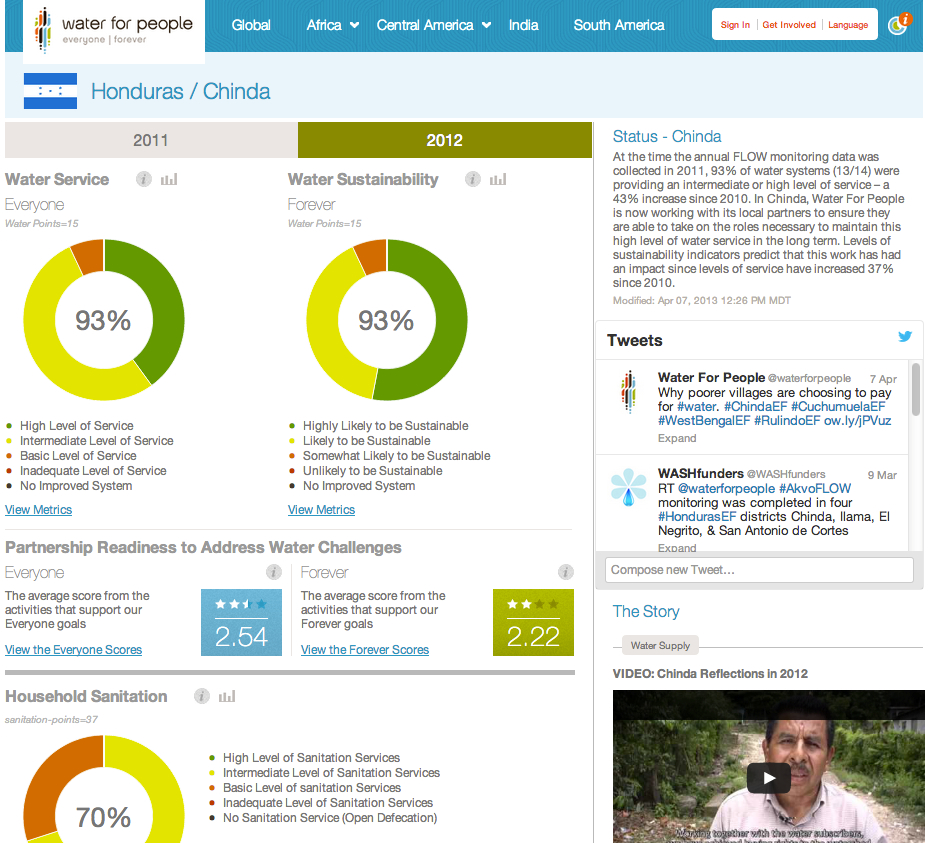
Country pages on the Re-Imagine Reporting platform such as this one for Honduras allow viewers to reflect on the progress of Water For People's work through data infographics as well as "The Story" depicted in videos, articles, and social media.
No longer will data be overwhelming and shelved without full absorption of its holistic meaning. That's not a good use of time, money, or data for any nonprofit or their donors.
Currently, we have completed data for Honduras, Guatemala and Malawi on the platform. Our other country programs will be added over the next several weeks, so come back often to see our global work come to life. Note that it's viewable in Spanish too.
Check out Re-Imagine Reporting at http://reporting.waterforpeople.org.
Eileen Lambert is the Senior Interactive Manager at Water For People.