
This is a joint article with my fellow co-blogger at the Bonddad Blog, New Deal Democrat
Most economic observers just project past trends - usually based on data that is coincident or lags the general economy - into the future, and so they miss important turning points. In short, they get it wrong. Even now, many are simply reporting the poor recent trajectories of data between 2008 and 2009 (exactly as could have been done at the end of the 1974 and 1982 recessions), and projecting that there is still an ongoing decline that will continue, or else picking through almost relentlessly positive economic reports looking for a negative number of some subset to grasp onto. There clearly are some nasty negative numbers out there. Jobs are still being lost and wage increases have become almost non-existent. International trade as reflected by the Baltic Dry Index and the LA and Long Beach ports data is negative. States and municipalities are still facing declines in tax revenues -- although the year-over-year comparisons are getting less negative.
What pundits miss is economic cycles run in a typical order including both expansions and recessions, as demonstrated by Prof. Edward Leamer:
The temporal ordering of the spending weakness is: residential investment, consumer durables, consumer nondurables and consumer services before the recession, and then, once the recession officially commences, business spending on the short-lived assets, equipment and software, and, last, business spending on the long-lived assets, offices and factories. The ordering of the recovery is exactly the same.
In fact, many aspects of the economy have stabilized. Many more have actually turned positive, including the most forward-looking aspects listed by Prof. Leamer above.
The best way to look into the economic future is usually just to look at the Conference Board's Index of Leading Economic Indicators, which are: real money supply, average weekly manufacturing hours, interest rate spread, manufacturers' new orders for consumer goods, supplier deliveries, stock prices, consumer expectations, building permits, average weekly initial claims for unemployment insurance, and manufacturers' new orders for durable goods.
The ongoing strength of the LEI's means that a prefect trifecta -- three out of three LEI measures linked with +GDP are positive now. Per Paul Krugman, we may have entered purgatory, but the fact is we are out of hell. While it is certainly possible that speculators could foolishly drive the price of oil over $100 again, and trigger another recession next year, the simple fact is, this Recession is over.
First, in the past, +LEI readings for 3 months in a row has typically meant the start of +GDP. Here is a graph, showing that since WW2, every time there has been a significant (~2%) turn up in the 3 month average of the LEI, a recovery (in the sense of +GDP growth) has started immediately. We got the third positive monthly reading in June. Since March, the index has increased from 97.9 to 101.6, well in excess of 2%.
Second, when the year over year reading of LEI is positive, that typically means the +GDP has begun. In July 2008 the LEI stood at 101.2 (2004=100). As of June 2009, the LEI stood at 101.0 (after a +0.1% revision). July's 0.6% increase puts the index at 101.6, which triggers the second signal. Here it is graphically:
Third, when 9 of the 10 indicators have been positive for 6 months, it has always signaled +GDP:
As of yesterday's +4.9% increase in durable goods orders, 9 of the 10 indicators now meet the criteria. Only new orders for nondurable consumer goods has not turned positve yet. All 9 of the others -- money supply, manufacturing hours, the bond yield curve, stock market, consumer sentiment, ISM manufacturing purchasing managers index, new orders for durable goods, and first time unemployment claims -- all of them are now positive over the last 6 months.
It's also important to note there is a large amount of confirming data. Let's start with the housing market.
New home sales have bottomed as have
Existing home sales. The primary argument made against the existing home sales number is it contains a large number of foreclosures. However, this commentary does not take into account that the market is absorbing this inventory. The reason is that thanks to falling prices homes are far more affordable now than in the past. I should also note that I agree with the blog Calculated Risk's analysis that we'll see two bottoms in the housing market: one in sales (which we are seeing) and one in prices (which we have not seen yet).
In addition, housing starts have also bottomed:
In addition, home builders confidence is currently at its highest point in a year:
The National Association of Home Builders said Monday its housing market index rose in August to the highest point in more than a year, as homebuyers hurried to take advantage of a federal tax credit before it expires.
In addition to the housing market, the financial markets have shown signs of healing.
First, commercial paper spreads have returned to normal levels.
In addition, the stock market has rebounded:
Money has flowed out of the Treasury market:
And into higher yielding corporate bonds:
And junk bonds:
And despite predictions of imminent collapse, the mortgage bond market is still doing well:
The above charts indicate that risk appetite has returned: investors are confident enough in the futre to move out of extremely safe assets like US Treasuries and into higher yielding less secure assets such as corporate, junk and mortgage backed-bonds.
In addition, we've seem commodity price increases in industrial metals:
This indicates that traders and investors feel manufacturing will start to increase. And given the recent numbers from the New York Federal Reserve and Philadelphia Federal Reserve they are probably right. First this is from the latest New York Federal Reserve's Empire State Index:
For the first time in considerably more than a year, the Empire State Manufacturing Survey indicates that conditions for New York manufacturers have improved. The general business conditions index increased 13 points, to 12.1, its highest level since November of 2007. Although the inventories index remained well below zero, the new orders and shipments indexes rose to their highest levels in many months. The prices paid index was positive, while the prices received index continued to be negative. Employment indexes were much improved from their recent low levels, although they remained below zero. Future indexes generally rose from last month and conveyed optimism about the six-month outlook; the capital expenditures index rose to its highest level in over a year.
As this chart of the index shows, this number has been rising since March and is now in positive territory.
And the Philadelphia Federal Reserve's manufacturing index shows a similar turnaround:
As does the Richmond Fed's manufacturing index:
And employment is showing signs of improvement. First 4-week moving average of initial jobless claims is still in a downward trend and has been for several months:
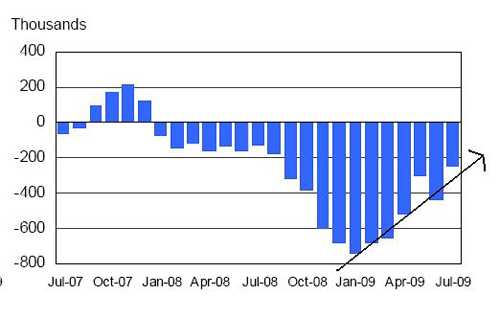
And the rate of establishment job losses is still trending lower:
In addition, now 2 of the 5 coincident indicators that members of the NBER use to date recessions are also up from their bottom, and a third stopped declining last month. Specifically,
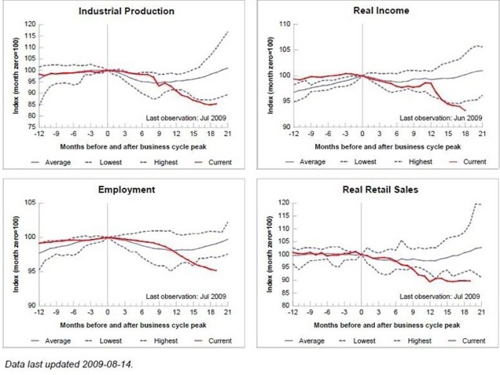
real retail sales may have hit bottom in December 2008, and after plummeting for months, industrial production surprisingly turned up 0.4% last month. Personal income is still declining badly, and employment is also still declining, although less so than earlier this year.
And finally, numerous other countries have printed GDP increases in the latest quarter.
If there were only one data point then this article wouldn't be written. But now we have a host of data points pointing in the right direction.
Just to review:
1.) The Leading Economic Indicators are pointing up strongly.
2.) Housing sales have bottomed
3.) Housing starts have bottomed
4.) Home builders confidence is increasing
5.) The stock market is rebounding
6.) Credit spreads are at low levels
7.) Traders have moved out of Treasuries and into corporate, junk and mortgage backed bonds
8.) The manufacturing indexes have been improving since the first part of the year and are now printing positive numbers
9.) Initial unemployment claims -- while still high -- have dropped and the rate of job losses has decreased.
10.) Other countries are now printing positive GDP numbers.
I'm on record as saying we'll have started to see positive GDP numbers between the 4th quarter of this year and the second quarter of next year. These numbers are pointing in that direction.
Let's add an important caveat. I (Bonddad now) am also on record as saying growth will be weak, printing somewhere in the 1% to 2% range with high unemployment. It's extremely important to remember where certain numbers were just recently. For example, an economy that loses over 600,000 jobs over a series of months is not going to print a positive jobs number for some time. That's simply the way an economy the size of the US's works. To expect otherwise is very unrealistic.
However, there are numerous data points that indicate the worst is behind us and the recession is over.