
It's now official: The country has lost more jobs as a percentage of peak employment than at any time since the Great Depression.
This includes the recessions of the early 1980s, even when they are combined.
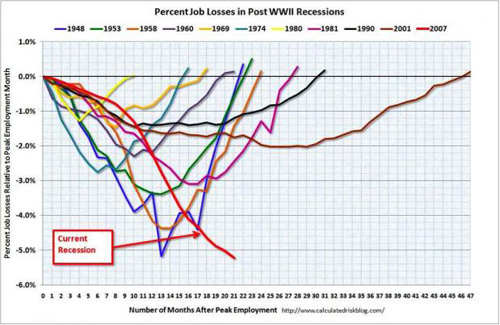
Those looking for a v-shaped recovery keep insisting that jobs will come roaring right back, the way they did in the 1948 recession. (see the blue line in the chart from Calculated Risk).
Anything's possible, but this seems unlikely. In 1948, U.S. consumers were not still saddled with the massive debts that are stifling consumption today. And consumers still represent 70%+ of spending.
The other interesting point with respect to the 1948 "V" is that we have now gone as many months from the peak as it took employment to recover in full in the 1948 recession. And we're still losing jobs.
Most importantly, regardless of what the jobs recovery eventually looks like, it hasn't started yet. The economy is still losing 250,000+ jobs a month. The average workweek, which should be the first indicator to turn up, also fell in August to match its record low. This would not seem to be consistent with a sustained, v-shaped recovery.