
There are many heroes in the story of Hurricane Sandy, but we arguably owe the greatest debt of gratitude to mathematicians who wrangle massive amounts of data to improve the accuracy of our weather predictions. Two devastating storms, decades apart, provide a fantastic snapshot of how weather prediction has improved thanks to the introduction of computational mathematics over the last century.
Just over 75 years ago, on September 9, 1938, above the warm tropical waters near the Cape Verde islands, a storm gathered. As the weather system intensified, it was ushered westward by the prevailing larger-scale ridge of high pressure over the Atlantic. By the 16th the storm had become a hurricane, and the captain of a Brazilian freighter caught sight of the tempest northeast of Puerto Rico. He radioed the U.S. Weather Bureau to warn them of the impending danger -- no satellites or sophisticated computer models to help the forecasters in those days.
A deep trough of low pressure over Appalachia forced the storm northward, avoiding the Bahamas and Florida, and towards the north-eastern seaboard of the United States. The forecasters were relying on real-time reports of the storm's progress, but it advanced at an incredible pace, moving northward at nearly 70mph. By the time the Weather Bureau realized it was on a collision course with Long Island it was too late. The death toll from the Great New England Hurricane approached 600, with over 700 injured, and the damage was estimated at $308 million -- or around $4.8 billion at today's prices.
History very nearly repeated itself on October 29 and 30th last year, when Hurricane Sandy slammed into New Jersey. Meteorologists referred to Superstorm Sandy as a "multi-hazard event," with major damage resulting from wind gusts, from high seas, from a tidal surge, from heavy rain, and even from driving snow. The number of fatalities in the U.S., attributed either directly or indirectly to Hurricane Sandy, were around 160: a tragedy, but mercifully fewer than the number killed by the Great Hurricane of 1938.
It is almost certain that timely warnings averted greater catastrophe last year. Unlike the storm of 1938, which caught forecasters by surprise, one of the most remarkable features of the forecast of Hurricane Sandy from the European Centre for Medium-Range Weather Forecasts (ECMWF) was the prediction made on October 20th, 48 hours before Sandy even formed, of a one-in-four chance of a severe storm, centered on New York, on October 29th/30th.
ECMWF routinely produce two types of forecast for 10 days ahead. As they state in a recent newsletter "The ECMWF global medium-range forecast comprises a high-resolution forecast (HRES) and an ensemble of lower-resolution forecasts (ENS)," and it was the ENS that helped forewarn of Sandy.
To calculate a forecast we use supercomputers to solve seven equations for the seven basic variables that describe weather: wind speed and direction (3 variables), pressure, temperature, air density, and humidity. The equations governing weather are highly nonlinear. This means that the 'cause and effect' relationships between the basic variables can become ferociously complex. To deal with the potential loss of predictability, forecasters study not one, but many forecasts, called an ensemble. Each member of the ensemble is started from a slightly different initial state. These different initial states reflect our ignorance of exactly how weather systems form. If the forecasts predict similar outcomes, we can be reasonably confident, but if they produce very different scenarios, then the situation is more problematic.
In the figure below the ensemble of forecasts for Sandy, starting at midday on October 23rd indicates the high probability of the 'left turn' and the most probable landfall -- information that helped save lives.
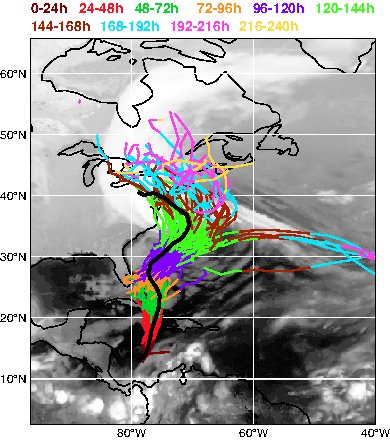
Forecasting Superstorm Sandy: The ensemble of forecasts covering the 10 days from the formation of the cyclone on October 23rd; the black line is the actual track of the storm. © ECMWF
The next figure shows the strike probability chart that highlights the region around New York within which there is 25 percent chance of a severe storm by midday on October 29th. This forecast was computed from an earlier ensemble starting at midday on October 20th and gave forecasters the vital "heads-up" of severe weather striking a highly populated area.
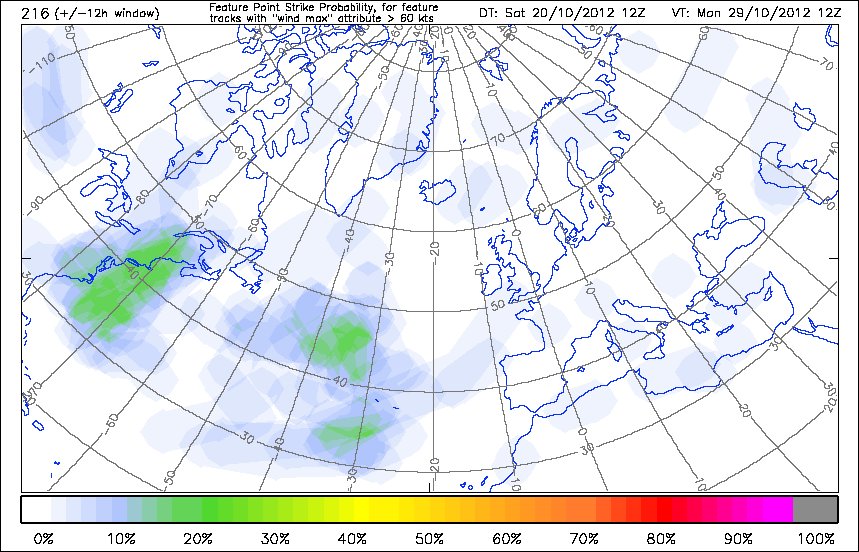
The storm strike probability from midday October 20th. © ECMWF
The science of weather and climate prediction was utterly transformed in the second half of the 20th Century by high-performance computing. But in order to fully exploit the computational power, and the information gathered by weather satellites and weather radar, we need mathematics. As we explained in our article in Scientific American, math quantified the choreography of Hurricane Sandy. And to account for the ever-present uncertainties in the science of weather forecasting, math delivers the tools to analyze the predictions and to highlight the dangers.
Lives were saved because of the quality of our weather forecasts, which are made possible by an international group of mathematicians and weather prediction centers. The math that helps us quantify uncertainty in weather forecasting is being used to quantify uncertainty in climate prediction. It is easy to underestimate the value of this research, but investing in this science is vital if we are to stave off future billions in damages
Roulstone and Norbury are authors of Invisible in the Storm: The Role of Mathematics in Understanding Weather (Princeton University Press, 2013).