Present economic conditions leave much to be desired: Europe is trying to resolve its debt problems, and the U.S. has seen much better times in terms of employment rates and consumer confidence. Against this backdrop of economic calamities, the financial markets are experiencing high volatility, seesawing up and down, gaining and losing in excess of 3% on a given day. Whether the current volatility is without a precedent, however, is up for a debate and depends on how volatility is measured.
The most common way to assess volatility is via standard deviation, a square root of the average of squared deviations of market returns away from their mean. While the formula can be a tongue-twister, the standard deviation function comes standard with most software packages, like Excel. It's easy to compute and is popular as a result. For the standard deviation metric to make sense statistically, it needs to be calculated on at least 30 consecutive market returns, which may not be the desired goal -- past observations may not be representative of the latest market conditions.
An alternative way to measure volatility is to use intraday movements of the markets. One such measure computes the difference between the highest and the lowest market prices observed on a given day, and then divides (normalizes) the difference by the closing price on same day. The resulting number is a percentage of the price that the markets have moved on a given day, and is considered a valid and timely measure by many academics and practitioners alike.
Both metrics, the historical standard-deviation-based volatility and the intraday volatility, show similar trends: when one rises, the other does too, although possibly to a different degree. The standard deviation metric tends to be much smoother, while the intraday volatility measure can have much steeper changes from one day to the next.
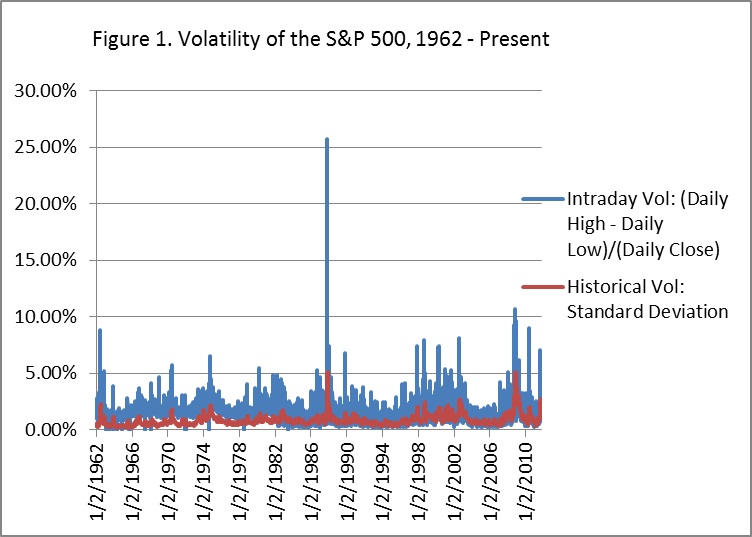
As far as historical precedents are concerned, however, the two volatility metrics produce different outcomes. Figure 1 shows comparison of the two volatility measures on the data of the S&P 500 index dating back to 1962. According to the historical volatility measure, recent volatility is hitting the all-time high levels, even equaling or exceeding that surrounding the Black Monday of 1987. According to the intraday volatility measure, current volatility is nowhere near the levels observed during the October 19 crash of 1987, when the S&P 500 registered a 25% move between its daily high and the low. Furthermore, present intraday volatility levels are comparable to those observed in the late 1990s, early 1970s and even 1962.
While the methodology used to compute volatility is the choice of the analyst, one thing is certain: high volatility takes time to die down. As Figure 1 shows, the clusters of high volatility are cyclical in nature and last around 4-6 years at a time. As a result, the high volatility levels the markets have experienced since 2008 may extend even through 2012.