Employers added 200,000 jobs on net last month, while the jobless rate ticked down to 8.5%, according to this morning's jobs report from the Bureau of Labor Statistics. That's a bit better than what was expected, reflecting moderate but broad labor demand across almost all sectors of the private job market -- the public sector continues to be a notable sore spot.
All told, a solid report, with most industries adding jobs, the workweek expanding a bit, and the jobless rate revealing a slow but steady trend down -- see figure.
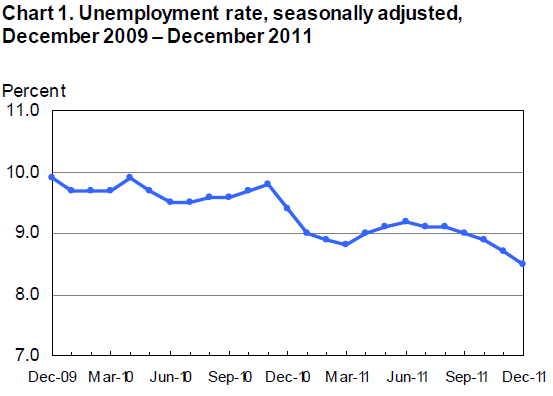
With December's data, we now have full year 2011 numbers. Payrolls added 1.6 million jobs last year, the best showing since 2006. Private sector payrolls were up 1.9 million, the most jobs added in the private sector since 2005.
In other words, the labor market is improving, and has a bit of trend going for it -- employers remain cautious, hiring can't be called robust -- but it has been slow and steady.
Securing, sustaining, and building on these gains, particularly in the face of economic risk factors -- Europe, oil, fading stimulus -- must become the top goal of policy makers who have heretofore been way too cavalier about this primary responsibility.
Update:
The Good:
- Payrolls expanded in every month last year, the first time we've seen that for awhile, adding 1.6 million jobs overall and 1.9 million in the private sector (continued public sector job loss is one of the bads).
- The figure shows the annual growth (December/December) or loss of jobs over the last three business cycles: 1990s, the 2000s, and the nascent recovery that's underway. The difference in job losses between the great recession and the prior two (1990-91 and 2001) is the first thing that jumps out at you. We've just got so much more ground to make up. But (hey -- this is supposed to be the good part!) we are starting to make it up. Too slowly for sure, but the figure shows we're climbing out of the trench.
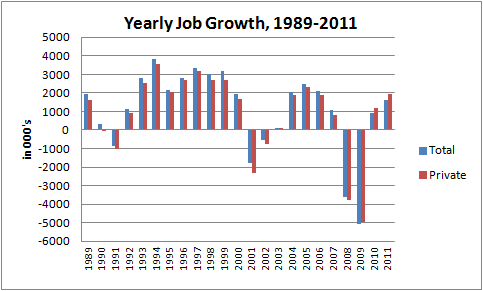
[The other thing you see in this figure is just how weak the jobs recovery of the 2000s was -- compared to the 1990s, there were precious few years of job growth -- and pretty anemic ones, at that. So, one question posed by this chart is whether we're at the beginning of a 90's or 2000's type of jobs recovery... and what policies will help generate the latter pattern over the former.]
- Unemployment is trending down. It peaked at 10% in Oct of 2010 and hit 8.5% last month. However, no small part of this decline is due to people leaving the labor force (see below).
- The underemployment rate is down 1.4 ppts from a year ago, from 16.6% to 15.2%, driven in part by the decline of almost 800,000 in the number of involuntary part timers (i.e., part-time workers who want full time jobs).
The Bad:
- Levels vs. Trends: On many of these labor market variables, the trend is our friend, the level bedevils. We've got some slow momentum going in job growth, but we're still millions of jobs below the pre-Great-Recession peak. The jobless rate is down 1.5 percentage points off of its peak, but 8.5% is way too high on the level.
- Job Quality: Many of the jobs we've added over the past year have been in low-paying sectors, like restaurants, bars, and retailers (part of the 200K gain last month, e.g., included 42,000 jobs for couriers/messengers, presumably related to holiday deliveries). On the other hand, manufacturing's picked up lately, up 225K over the year.
- Labor Force Participation: This is the most notable bad we face right now. The share of the working-age population either working or looking for work remains depressed, surely because a lot of people gave up the job search in an inhospitable environment. This makes the decline in unemployment look better than it really is, because once you leave the job market you're not counted among the unemployed. It also means that once things pick up, some of those folks are going to get drawn back into the job search and that puts upward pressure on the jobless rate. I expect this to occur this year.
- Long Term Unemployment: Still a huge problem, with over 40% of the jobless unemployed for at least half a year. Again, it's a testament to the mismatch between labor supply and labor demand, with the latter improving but still far too weak to meet the needs of those seeking work. And please, don't blame extended UI (unemployment insurance) benefits for either this bad or the last bad (lower labor force participation). Re the former, we've just got too many job seekers chasing too few jobs. Re the latter, you have to look for work when you're on UI, and that rule is enforced pretty strictly.
- Public Sector: The state and local government sector continues to shed jobs, down about half-a-million over the last two years. They're cutting budgets and taking it out of their workforces, and remember, these are teachers, police, sanitation workers -- folks whose work is essential to our communities (education jobs at the local level are down 190K over the past two years).
The Ugly:
That would be Congress. As I said earlier, policy makers need to sustain and build upon the gains we've achieved thus far. Fiscal support is fading and the private-sector engine of job growth is still somewhere around first or second gear. Whether we slog along or build to a more robust recovery is at this point a function of whether these guys create more self-inflicted wounds, like failing to extend the payroll tax cut and UI benefits beyond two months. Or whether they respond to any forthcoming problems we can't see yet -- if Europe or oil or who knows generate new headwinds, it's hard to imagine this Congress helping to offset them.
This post originally appeared at Jared Bernstein's On The Economy blog.
Working on Census and IRS data, David Cay Johnston reported in the NYT, Nov 2006, that the recovery from the recession of 2001 was similarly slow and incomes were lower in the election year of 2004 than they had been in 2000. Incomes were up 1.8% over 2004 for the poorest 5th of Americans and up 27.5% for the top tenth of 1%. Thereafter, there was a substantial improvement until the shocking collapse of 2008.
I would like to think we can expect a substantial recovery until 2014-15, and with better policies in place, we might avoid a repeat of the Bush collapse. We'll have to see what kind of bubbles we have still to try out as the very rich strive to become very very richer.
Kai
Happy New Year.
Actually research shows that tax cuts are the strongest form of stimulus. More importantly, countries that have been in fiscal crises performed better by relying on spending cuts to tax increases to get themselves out. The key is that they must be made permanent.
You state, ‘and, of course, joblessness while corporations and the wealthy "job creators" are raking in record sums bears that out.’
This is where you are incorrect. actually profit margins would go up in a time of quantitative easing and fiscal spending, both of which increase the amount of artificial spending and demand without addressing the underlying structural problems. Business owners are smart to meet that demand with existing inventory or increased overtime but no new hiring due to the fact that they can foresee that such stimulus is a) artificial and b) unsustainable. Furthermore they are sitting on that cash instead of spending it because of economic and policy uncertainty that presages a need for cash in the future, perhaps a Euro collapse etc. These companies are not worried about hiring, they are worried about surviving and will horde cash to ensure that their current workers, and they, live to fight another day, etc. Expect that cash to be put to work the minute the economy signals that it is prudent to do so. No amount of stimulus will bring that signal forward.
Ask the Keynesians, despite all their gimmicks businesses understand that pumping more cash in to an economy that is suffering from a resource and labor misallocation (housing, mortgage, securitized lending, etc.) does not, indeed, fix those problems and that free market forces are needed to correct the economy forcing a restructure to sustainable levels.
Kai
How is this even possible?
Businesses don't hire unless Government continues to stimulate right?
This doesn't mean, contrary to right wing policies, that the government has to be the enemy.
At different periods during 2007-2008, the United States of America was rudderless. The hawks were concentrated on their illegal wars.
We should never forget!!
Let's not forget that even today employers often insist they can't find qualified US workers. So they bring in H-1B, L-1, J-1, OPT indentured servants who "coincidentally" come largely from low wage countries (forget Japan or West Europe). Let's stop coddling our employers like that!!!
Immigrants like all Americans apply for jobs and they are GIVEN jobs on the basis of their qualifications.
Take off the patriotic blinders. Our problems are bigger than the immigrant whipping boy argument.
Do you think it's a "coincidence" Bill Gates and other CEOs constantly insist they can't find qualified workers? And it's a further coincidence H-1B, L-1, etc workers come overwhelmingly from low wage countries such as India. Amazing how they can't find qualified workers in higher wage well educated countries such as Japan or Western Europe.
I really have to disagree with you. Immigration truly is damaging employment and everyone except the employers who benefit from cheaper labor costs!!!
The United States Congress panders to campaign contributors, protects their ability to trade stocks on insider information that would send the rest of us to jail, enjoys taxpayer funded health care benefits which the taxpayer does not qualify for, dines on high quality taxpayer subsidized food and exercises in state of the art taxpayer subsidized gymnasiums while declaring pizza is a vegetable and schools deteriotate and fight wars with the children of the poor and disenfranchised while proctecting their own children and the children of their campaign contributors from risking their lives.
The United States Congress ruined the employment opportunities of millions of Americans and they are destroying our Democracy.
It will be interesting to see if Congress gets better when these TPers are one-termers after next November. As long as big $ rules the office holders I doubt anything will change -- can Congress' approval rating actually go into the negative nos?
1. outsource and offshore through bought tax/tariff code
2. Create huge floods of cost of living inflating cash feeding the inflation driving trades of UNTAXED entities
3. Give untaxed entities the right to buy preference to grow and outprice land and life's necessities for Americans.
4. Flood the housing mkt and loanshark American homeowners.
5. Get fFed access to American property to drive oil and c.o.living high while outsourcing wages ay down. Crash the mkts and profiteeron oil drivong food higher.
6. Start pirating homes, on the debt created.
7. DEFUND GOVERNMENT SUPPORTING THE POOR CREATED. DEFUND UNEMPLOYEED
8. TURN AMERICANS ON THEIR OWN PROGRAM STRESSED GOVERNMENT FOR OPERTATING COSTS WHILE Corps PAY NO, OR LITTLE TAXES.
9. Trick the public into defunding THEIR ONLY DEFENSE, against intl/banker racketeers.
10. Commandeer, even the democratic vote, once representing consumer/worker interest.
If you are retired, nearing retirement, or below the median income (that's half the country), food, fuel, and healthcare eat up much of your budget and prices are skyrocketing.
The boomers brought it upon themselves by electing Republicans who borrowed and spent like there was no tomorrow. Then, cut retirement benefits by allowing companies to raid their retirement plans or switch them from assured benefits to savings programs. Even Social Security has been sharply cut by the method of indexing for inflation. Wages and benefits have been reduced by relatively high unemployment. It seems true that inflation causes falling real wages and only the richest can exploit it.
And what have they learned from this? Nothing. They rallied to right wing corporatists and their know-nothing Tea Party movement which wants to abolish every social program.
"Not in labor force" went down slightly as a trend (that is, the slope decreased), but increased numerically.
How about the employment rate -- the most-important number in there, since it controls the taxing capacity of the government.
That's not good -- it's down a touch and has flat-lined now for basically two years.
Here's the problem with this report -- the non-institutional working-age population went from 240.441 million to 240.584, a gain of 143,000 people of working age.
But the number of employed people went down from 141.070 million to 140.681 -- a loss of 389,000.
Adding the two, which is the correct way to look at it, the economy on a population-adjusted basis lost 532,000 jobs.
http://globaleconomicanalysis.blogspot.com/2012/01/employment-trends-since-1955.html
On today's labor report: Note how the labor force has flat lined for four years even though population growth has averaged 1.5 million for the past 55 years.
From 1993 to 2007 population growth was 1.7 million per year!
The work force is literally one million smaller than during Bush's last year in office. This is statistically impossible, at least judging from historic trends.
We also are still 5.6 million people below the employment number of the peak year in 2007. So, practically speaking we have approximately 11.6 million more people unemployed than in 2007.
Number of people employed in November was 140,614,000. Number employed in December was 140,790, a gain of 176,000 jobs.
The civilian labor force actually went up during the worst of the recession but went down in 2010 and 2011. The size of the labor force and the labor force participation rate are functions of individuals' decisions as to whether or not they want to seek work. We'd have to do some analysis to see how much of the decline in the participation rate is due to baby boomer retirements and how much to workers becoming discouraged. But the rate peaked in the 1990s and many expected it to decline as the population ages.
We are still 5,257,000 short of the number of employed persons at the peak of the business cycle in 2007.
The working age population has increased by 8.7 million since 2007 while the number not in the labor force has increased by 7.95 million. http://www.bls.gov/web/empsit/cpseea01.htm
Bottom line: The economy has been creating jobs at a pretty good clip but full employment is several years away, assuming the economy isn't derailed by an oil shock or a banking crisis.
The population of the USA has increased every year for the last decade so workforce participation rate is one of the key indicators to how well the economy is actually performing.
Food stamp usage (SNAP) keeps increasing every month instead of decreasing like it would if the economy was actually improving.
Please note that the ONLY way to COUNTER the UGLY NARRATIVE that the GOPteaers have spread for almost 3 years in AMERICA to DEPRESS the spirits of the people and TANK the Econ for defeating OBAMA
IT IS NOT WORDS , not even Yours ........but GRAPHS .
Graphs are like the PICTURES which are more than 1000 WORDS.
USE the RED And BLUE graph of Job creation and the one ED schultz shows about the INCOME Growth of the 1 % = 275 % red line MONEY makes $$$$$$$ specially if it is taxed at 15 %
and the blue line for the lower income people which shows a bit of growth.
THE REASON i specify RED and BLUE is because tonight CNN put that JOB creation graph ONLY In BLUE and it was ridiculously not OBVIOUS. ANDERSON should be ashamed not to have used the GOOD red and blue graph !!!!
every single Dem candidate should be equipped with this 2 graphs to make their point.
EVEN OBAMA should have someone present it in every campaign stop before he comes on stage