
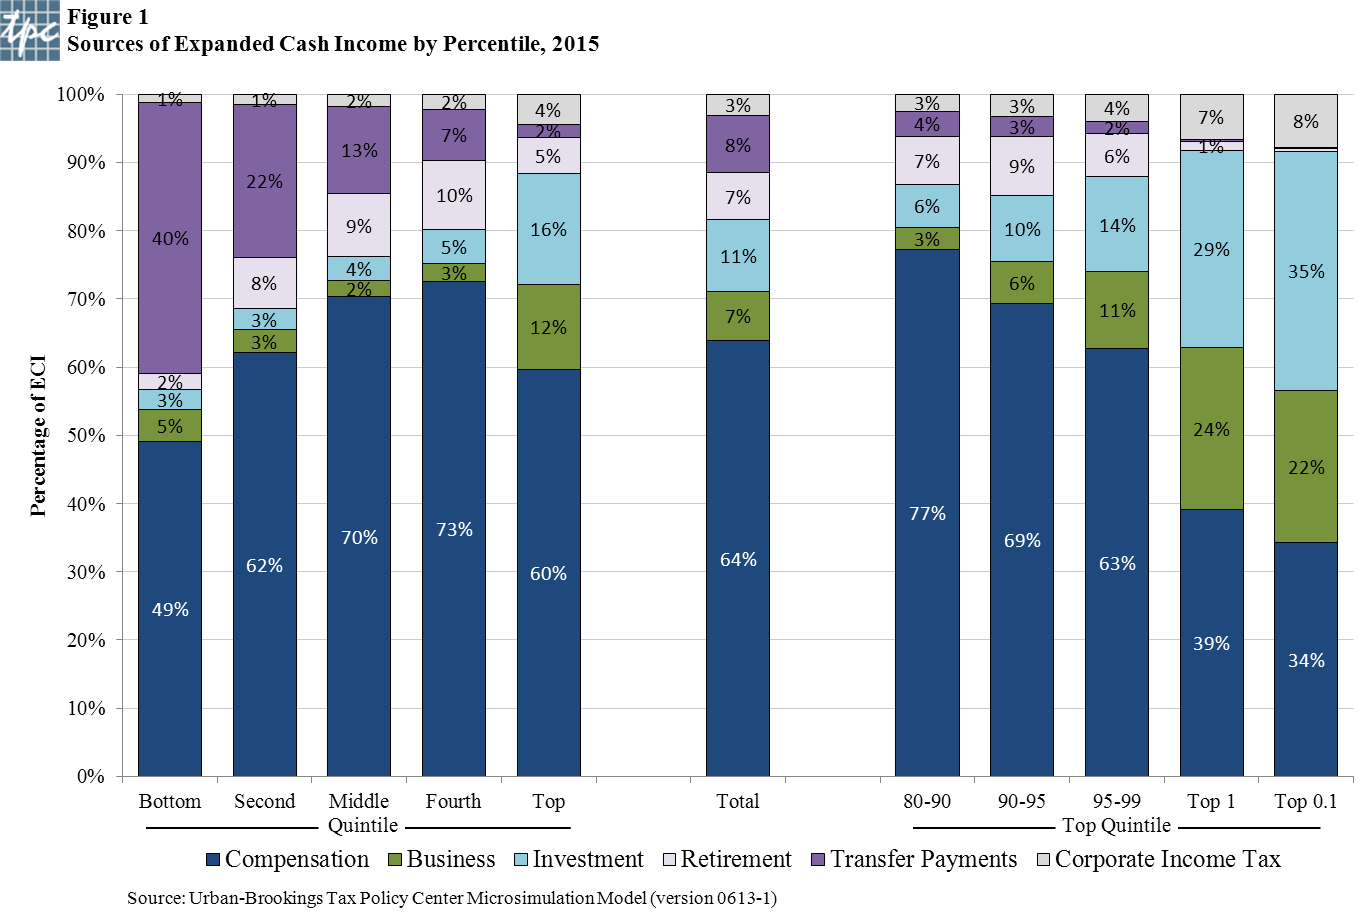
The Tax Policy Center has added some strong new hamsters to turn the wheels of their much used income and tax model, and in doing so they've expanded their definition of income. You can read all about it here, but just eyeballing their figure 1, pasted in below (you need to click on it to get a better view), I was struck by the changing patterns of income composition as you go up the scale.
Like they say, where you stand is often a function of where you sit. Though these data are not surprising, they do serve as a reminder that the concept of "the economy" means different things to different people for good reasons. How a given policy measure affects you has a lot to do with where you locate on this chart.
For example, for households in the bottom 99 percent, at least half of their income comes from work in the form of compensation, which includes not just wages but also employer-paid health premiums and retirement benefits. For middle-income households, the compensation share of income is 70 percent.
For high-income households, say those in the top 1 percent, compensation is just 40 percent, while investment income, including cap gains, accounts for 29 percent, compared to 4 percent for the middle class.
Transfer payments, including Social Security benefits, unemployment insurance, and food stamps cover a large share of income -- 40 percent -- for poorest households, but are only 2 percent for the top fifth. (See the paper for definitions of the other income components.)
Think about these differences the next time you hear a politician explaining why we need to cut taxes on corporate income or capital gains. Or better yet, why, as in the House budget, we have to slash the safety net in order to pay for such upper-end tax cuts.
The framing is invariably "trickle-down" -- such cuts will lift everybody's fortunes -- but the real motivation is what you see here. Once you get up to the very top of the income scale -- the top 0.1 percent in the bar furthest to the right (as it were) -- you've got two-thirds of their income coming from non-labor sources.
Or think about the current economic context with an under-performing job market generating stagnant middle-class earnings amidst high corporate profitability and solid equity gains in the stock market. That's a very different experience for those with a 70 percent compensation share versus a 34 percent share.
In this regard, if we were going to make economic policy based on broad averages, we'd devote 64 percent of our energy to improving the job market. Just sayin'...
Source: Tax Policy Center
This post originally appeared at Jared Bernstein's On The Economy blog.