This past December, we (BuildZoom) published an article explaining the overall growth we observed within the solar industry. A quarter removed from 2013, we'll take a look back at how solar installation performed in 2013.
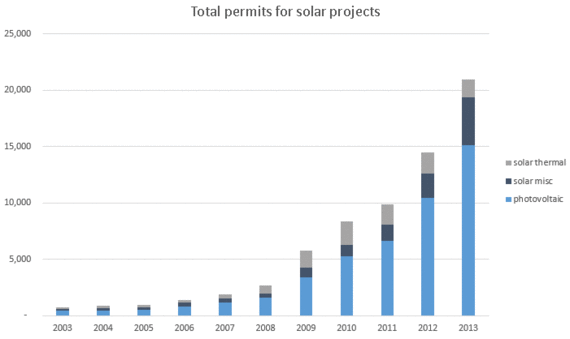
In 2013, we observed that the total number permits issued for solar projects, increased by 45 percent over the previous year.
Nearly all growth within this sector could be attributed to photovoltaic projects; the total number of permits issued for solar thermal projects actually decreased by 15 percent, from 2012 to 2013.
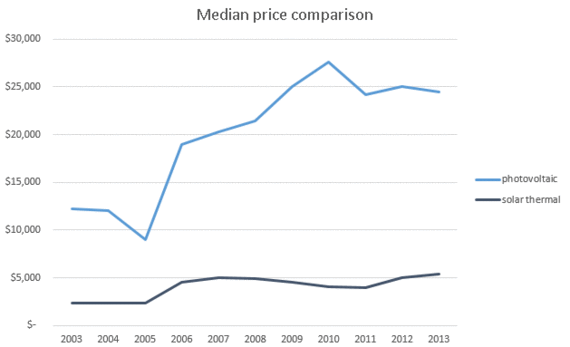
Given the significant difference between the median price of photovoltaic and solar thermal projects (illustrated in the following graph), the year-over-year growth within the sector can be considered even more impressive.
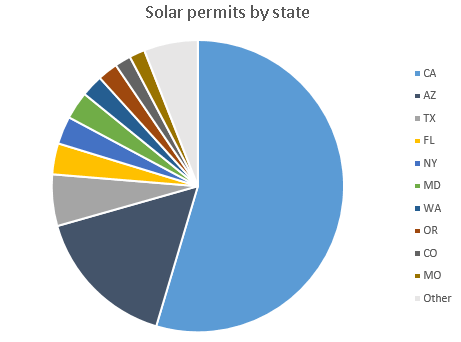
From a regional standpoint, California dominated the rest of the nation, in terms of overall permits issued for solar projects. Collectively speaking, California, Arizona, Texas and Florida accounted for nearly 75 percent of all the solar permits we identified (from an overall set that spans 600 cities and counties across 35 states). This number may be skewed based on regional differences in how solar installation projects are regulated.
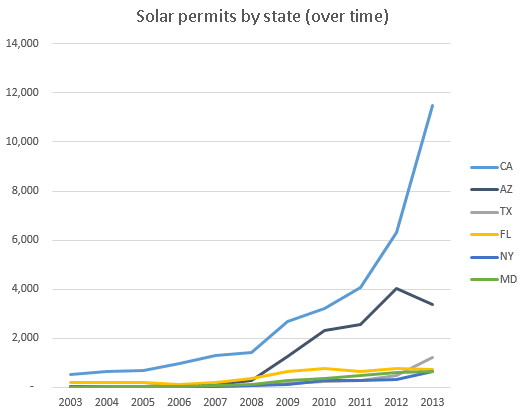
Looking at permits issued by state on an annual basis, illustrates how California has begun to distance itself from the rest of the country.
Arizona and Florida actually took a step back in 2013 while New York, Washington, Oregon and Maryland all took a step forward.
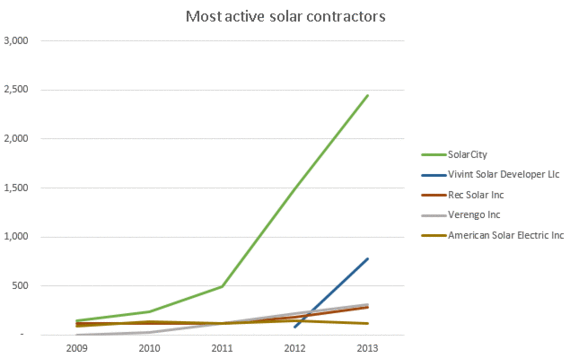
In terms of the service providers within the sector, SolarCity is the 800 pound gorilla although relative newcomer, Vivint Solar, burst onto the scene in 2013 to take second place.
To browse solar projects taking place throughout the U.S., visit our construction map. For more analysis of the construction industry, visit the BuildZoom Blog.
About the analysis -- data was compiled from a set of over 75,000 building permits specifically classified as "solar installation" projects, gathered from over 600 cities and counties in 35 states. These were then further classified into "photovoltaic projects," "solar thermal projects," or "solar (miscellaneous).
