So if you haven't heard yet, the sea ice in the Arctic is quickly melting away due to our continued burning of oil and gas that scientists say are causing all sorts of disruptions in the Earth's climate.
While most people don't need any more proof that the Arctic is melting, new spy satellite photos released by the U.S. Military today put the nail in the climate change coffin. According to Suzanne Goldenberg at the Guardian the images remained a secret under the Bush White House but have now been declassified by the new administration.
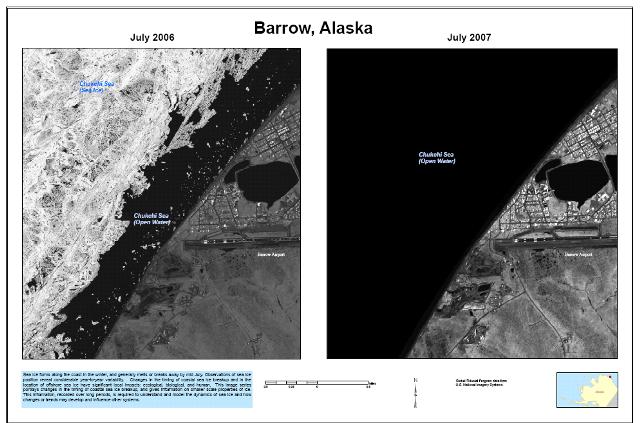
Here's a particularly mind blowing photo set:

You can see the entire photo set on the US Department of the Interior's website.
Follow Kevin Grandia on Twitter: www.twitter.com/kgrandia
Want to reply to a comment? Hint: Click "Reply" at the bottom of the comment; after being approved your comment will appear directly underneath the comment you replied to
In recent years, Arctic sea ice melt onset has begun earlier than in the past, and 2009 continues this pattern. Compared to average conditions over the period 1979 to 2000, melt this year started a week early in the Beaufort, Chukchi and Kara seas. In some regions such as the East Greenland and the Barents seas, melt began more than two weeks earlier than usual."
dc.org/arc ticseaicen ews/index. html
http://nsi
If the sea ice is just melting away, why is it that the level of Sea Ice today is greater than in 2007?
The year 2007 was the hottest on record, according to NASA. Arctic sea ice is slightly above the minimum reached in 2007, but way below historically healthy levels. Arctic ice does not have to reach new lows each year for the long-term trend to be towards ice free summers in the relatively near future. The year 2008 was a relatively cool one, but still the eighth warmest on instrumental record. It was cooler than the previous year because of low sunspot activity and a cooling la Nina. Still, the ice has almost reached its lowest level in recorded measurement. It really is not so hard to understand that the trend is towards ice free summers perhaps as soon as 2015.
dc.org/dat a/seaice_i ndex/image s/daily_im ages/N_tim eseries.pn g
http://nsi
I know deniers are not influenced by reasoning and facts, but I do not know another way to explain it!
The Canada Ice Service has reported, on August 1, 2009, that ice conditions "are delaying any potential navigability of the Northwest Passage this year."
Guess those alarmist scientists have got it wrong again. Who is surprised?
Richard, scientists predicted originally that the Northwest Passage would be navigable in summers due to warming in about 2040. The fact that it is almost navigable now is very discouraging and shows that Arctic warming has progressed far more than initial forecasts. It is amazing how deniers think that very negative trends, which are happening far sooner than climate scientists first expected, somehow supports their case. But then to them, everything supports their wacky case.
The lows of 2007 were the lowest in recorded history. The year 2009 is slightly above that low. It is hardly a recovery, especially given a relatively cool year.
Amunden took two years to sail through the Arctic in a small boat, hugging the shoreline. It was hardly comparable to the entirely ice free Arctic that scientists are talking about occurring soon.
Yes, the Arctic Sea Ice extent as of today is about 15% greater than it was in 2007, and the difference is likely to increase as we approach the minimum sea ice level for the year, as the graph line for 2009 sea ice is starting to bottom out by leveling off, while the sea ice level continued to drop at a steeper rate in 2007.
So two years have passed since the low in 2007, and the sea ice is recovering nicely. Looks like the earth's climate has turned a corner.
One could listen to Richard's unschooled bloviations or listen to actual scientists at the Study of Environmental Arctic Change, who say...
."
.arcus.org /search/se aiceoutloo k/2009_out look/repor t_july.php
"The outlook for arctic sea ice for September 2009, based on June data, indicates a continuation of low pan-arctic sea ice extent and no indication that a return to historical levels will occur."
"The range of individual outlook values this month is from 4.0 to 5.2 million square kilometers, with most of the estimates in a narrow range of 4.4 to 5.2 million square kilometers. The two lowest estimates, 4.0 and 4.2 million square kilometers, would represent a new record minimum. All estimates are well below the 1979–2007 September climatological mean value of 6.7 million square kilometers
"Although the majority of the responses indicate either persistent conditions or a slight increase over the 2008 sea ice extent, there appears to be about a 20% chance of reaching a new minimum in 2009."
http://www
Why do deniers take the liberty to invent their own data and their own trends and then claim their inventions overturn established science?
Despite a relatively cool la Nina and lowest sunspot activity in 50 years, last year was still the 9th warmest on instrumental record according to NASA. Still Arctic ice has almost reached the lows seen in the 2007, which was the warmest year on instrumental record.
dc.org/dat a/seaice_i ndex/image s/daily_im ages/N_tim eseries.pn g
"
"
.arctic.no aa.gov/rep ortcard/at mosphere.h tml
http://nsi
is it a wonder? According to the Arctic report Card,
"Autumn temperatures are at a record 5º C above normal, due to the major loss of sea ice in recent years which allows more solar heating of the ocean. Winter and springtime temperatures remain relatively warm over the entire Arctic, in contrast to the 20th century and consistent with an emerging global warming influence.
"The year 2007 was the warmest on record for the Arctic, continuing a general, Arctic-wide warming trend that began in the mid-1960s.
"The summers of 2005 through 2007 all ended with extensive areas of open water (see sea ice section). This allowed extra heat to be absorbed by the ocean from solar radiation. As a result ice freeze-up occurred later than usual in these years. Surface air temperature (SAT) remained high into the following autumns, with warm anomalies above an unprecedented +5° C during October and November across the central Arctic."
http://www
Gee, the Arctic ice has been melting away, and then refreezing, year after year, after year. There is an annual pattern here. There is much documentation of this pattern. But what is the cause of this annual pattern?
Doesn't seem likely this pattern started because someone decided to burn oil and gas. Seems likely the pattern has existed for hundreds, or thousands of years, long before humans were burning oil.
Also, within historical times, men have found the minimum Arctic Ice to fluctuate widely. This fluctuation in the level of minimum Arctic Ice is another reoccurring event, not something amazingly new. 2007 was a year for low minimum Arctic Sea Ice. 2008 was higher. Here we are in 2009, and no one knows yet whether the 2009 Arctic Sea Ice will be higher, or lower than in 2007. It is just nature. It is just natural variation in the Sea Ice.
Richard, you have a unique way of dumbing things down. I am glad you did not decide to become a school teacher. You say "Well, ice just melts. It just comes and goes." Fortunately, some in scientific circles have more inquiring minds. Despite being a relatively cool year last year, only the ninth warmest on instrumental record, autumn temperatures are at a record 5º C above normal in the Arctic.
.arctic.no aa.gov/rep ortcard/at mosphere.h tml
dc.org/arc ticseaicen ews/index. html
http://www
"Early or extended melt in response to rising atmospheric temperatures appears to be one of the factors contributing to the sharp decline of summer Arctic sea ice extent. When ice melts earlier, it leads to a lower albedo surface that absorbs more of the sun’s energy and promotes further melt."
"In recent years, Arctic sea ice melt onset has begun earlier than in the past, and 2009 continues this pattern. Compared to average conditions over the period 1979 to 2000, melt this year started a week early in the Beaufort, Chukchi and Kara seas. In some regions such as the East Greenland and the Barents seas, melt began more than two weeks earlier than usual."
http://nsi
The earlier melt has ramifications from survival of polar bears to lowering albedo and reaching new temperature highs.
Believe it or not, Richard, there are still facts in the world.
Thanx for the entertainment Nooooorm. I'll be laughing over your inane comments for days. But it's getting boring.
I'm out.
MG, they grow tiresome very quickly!
You know Nooooorm, if you're not satisfied with progress of that hole you're digging, Iv'e got an even bigger shovel I'll let you borrow.
LOL!
The fish are getting bigger, and the barrel is getting smaller.
Ghams... did you already forget that Global Warming is making fish smaller?
s.yahoo.co m/s/afp/20 090720/sc_ afp/scienc eusfrancec limatewarm ingfish
http://new
"CHICAGO (AFP) – Fish have lost half their average body mass and smaller species are making up a larger proportion of European fish stocks as a result of global warming, a study published Monday has found."
I knew when I made reference to bigger fish, you'd respond with this Nooooorm.
LOL!
Now, if Nooooorm follows SDOP,( Standard Denier Operating Procedure) he'll just start making things up.
.....Wait fooooor it.....
Didn't have to wait long.
Exactly what has been "made up" Ghams?
"However, unlike suggested by some, comparing summer ice conditions in july 2006 and 2007 is not sufficent evidence to verify a trend".
Wow, really?
After years of using short term variations in weather to argue that GW is a hoax, all of a sudden GW deniers are claiming that you can't use short term variations to claim that GW is real?!?!?!?
BTW, the dramatic loss of ice we're seeing in these photos is a continuation of an established trend, so is very significant, and sufficent to verify that trend.
I also find it very interesting that this dramitic loss of ice happened at a time when the deniers are crying from the rooftops that there has been no warming since 1998.
One can get whiplash trying to keep up with the switchback logic employed by GW deniers.
Ghamma,
Take about 2 minutes and visit the University of Alaska's site.
When there, look at the time-lapse composites of the webcam.
See how the ice comes in and flows out throughout the year?
See how it happens in the summer and fall?
See how it is a perfectly normal, natural occurance that cannot be attributed to "climate change"?
Well.. of course you can't.
In your world, any and everything is "climate change".
Instead of putting the "nail in the coffin of climate change", Mr. Grandia has humiliated himself with this posting.
Well Nooooorm, I took more than 2 minites on the UA site. Good thing to. I did notice that ice fluctuated throughout the year. What I also noticed was that as the years progressed from 2000, there is less and less fluctuating ice overall.
Guess you didn't notice that.
Just what I'd expect from someone who can't get my screen name right, even though it's on the screen.
For an updated source for Arctic sea ice, try this Danish site. It indicates the current 2009 sea ice level is above the level of 2007. Sure looks like natural variation rather than a man-made disaster.
an.dmi.dk/ arctic/ice cover.uk.p hp
http://oce
The graph does not show the ice decline in terms of any baseline years and therefore is meaningless for comparison purposes. Come on, deniers! You have to do better!
So why were the photos kept secret?
And those normal, natural forces that keep the ice coming and going are called winter and summer.
Must be a conspiracy. Good thing we have whistle-blowers like Mr. Grandia.
Has anyone allowed for the possibility that all U.S. Military spy plane photos are initially just automatically kept secret as a matter of policy?
Ya, ice is definitely a national security threat.
Mr. Grandia's post is a perfect example of global warming alarmism.
.gi.alaska .edu/snowi ce/sea-lak e-ice/Brw0 9/forecast /
It takes a snaphot, and proclaims to put the "nail in the coffin of climate change".
The problem for Mr. Grandia is that the photo proves no such thing.
http://www
"We would like to emphasize that the images released are scientifically extremely valuable. They both clearly demonstrate the year-to-year variability of ice conditions and document the progess of summer ice break-up in Barrow 2006 in unprecedented detail. However, unlike suggested by some, comparing summer ice conditions in July 2006 and July 2007 is not sufficient evidence to verify a trend."
The site reviews ice extent from 2000 to present, showing ice frequently coming and going from the Barrow coast due to normal, natural forces.
The nail Mr. Grandia refers too is the one he's driven into his credibility.
Ask any pilot who flies over the pole---the ice is steadily receding, whether you choose to believe it or not
Yes, comparing summer ice conditions in Barrow, Alaska is not sufficient to verify a trend for that it takes a look at the whole region over several years and the data indicates the Arctic ice is rapidly melting sooner in the spring and returning later in the fall. Everyone, but a denier can see what is in front of their eyes.
.washingto npost.com/ wp-dyn/con tent/artic le/2009/04 /06/AR2009 040601634. html
"The Arctic sea ice cover continues to shrink and become thinner, according to satellite measurements and other data released yesterday, providing further evidence that the region is warming more rapidly than scientists had expected."
"The satellite data released by NASA and the NSIDC show that the maximum extent of the 2008-2009 winter sea ice cover was the fifth-lowest since researchers began collecting such information 30 years ago. The past six years have produced the six lowest maximums in that record, and the new data show that the percentage of older, thicker and more persistent ice shrank to its lowest level ever, at just 9.8 percent of the winter ice cover."
"We're seeing an ice cover that's younger and that's thinner as we head into summer," Walt Meier, a scientist at the National Snow and Ice Data Center, said in a telephone news conference. "It's been a pretty sharp decline."
http://www
2007?
•July 3: (Aqua/MODIS) shore-fast apparently melting in place and slushing around at the coast (cf. MODIS images of July 5, 6, 8, 9, 10; sequence)
•July 6: (Landsat) landfast ice present, but possibly detached from shore South of Niksiuraq
•July 7: (RADAR) near-shore movement of ice
•July 11: (Terra/MODIS) ice appears to be able to drift past Point Barrow now
•July 15: (Landsat) (detached?) landfast ice still present
•July 22: (Landsat) shore is ice free; still a lot of ice in Chukchi Sea
•July 24: (Terra/MODIS) shore is ice free; still a lot of ice in Chukchi Sea
•August 2: (Terra/MODIS) ice islands (remnants of July 24) dotted along the coast
What about 2008?
•July 5: (AVNIR-2) landfast ice in place
•July 8: (RADAR) significant near-shore movement North of Browerville/NARL
•July 9: (AVNIR-2) landfast ice gone between Browerville and Point Barrow, Chukchi Sea full of ice
•July 10: (AVNIR-2) landfast ice gone between Browerville and Point Barrow
•July 13: (RADAR) break-up downtown Barrow during change of ice motion >5 km off-shore
•July 14: (Terra/MODIS) ridged ice still in place
•July 17: (Terra/MODIS) ridged ice still in place
•July 20: (RADAR) pressure ridges offshore NARL disintegrating July 17–20
Thanks, Noooorm! But what, if anything, do these dates mean?
http://www .gi.alaska .edu/snowi ce/sea-lak e-ice/Brw0 9/forecast /
•July 8: (RADAR) ice break-up complete South of Browerville
•July 9: (ERS-2) level ice starting to drift out South of Point Barrow
•July 12: (Terra/MODIS) coast ice free, ice island off-shore between Browerville and Point Barrow
•July 12: (ERS-2) coast ice free, ice island off-shore between Browerville and Point Barrow
•July 13: (Aqua/MODIS true color, Ch. 7,2,1) off-shore ice island
•July 14: (Aqua,Terra/MODIS) ridged ice still in place
•July 15–&: (MODIS July 15, 16, 18) ridged ice breaking out
•July 20: (Aqua/MODIS, photo by Craig George) last pressure ridge
•July 23: (ERS-2 23 July) last pressure ridge
•July 27: pressure ridge still in
You must be logged in to comment. Log in or connect with