Americans are buried in an avalanche of public opinion poll results. As a service to Huffington Post readers, we've assembled a list of things worth knowing and remembering when dealing with polls and opinion data presented in the media.
Who's Asking Whom? When confronted with polling data, ask yourself, "who is being asked, and who is doing the asking?"
Every opinion survey is an attempt to tell a story about a population of people. The population is everyone who fits the category of people of interest. It can be the general population (everyone), the potential electorate (those eligible to vote), the likely electorate (those who are eligible and will probably show up to vote), or finer and finer subsets of the general population. How pollsters define the population can make a significant difference both in the results and in their interpretation as candidate support can vary significantly across likely voters, registered voters, and the general population.
But we can't ask everyone - the costs are too high - so we ask a sample, a subset of the population that has been 'pulled' and then quizzed. Ethical pollsters strive for representative samples, which closely resemble the population being studied. Representativeness is most often achieved through random selection. Sometimes those random samples are weighted to achieve a balance of input from underrepresented groups in the sample (more on this later).
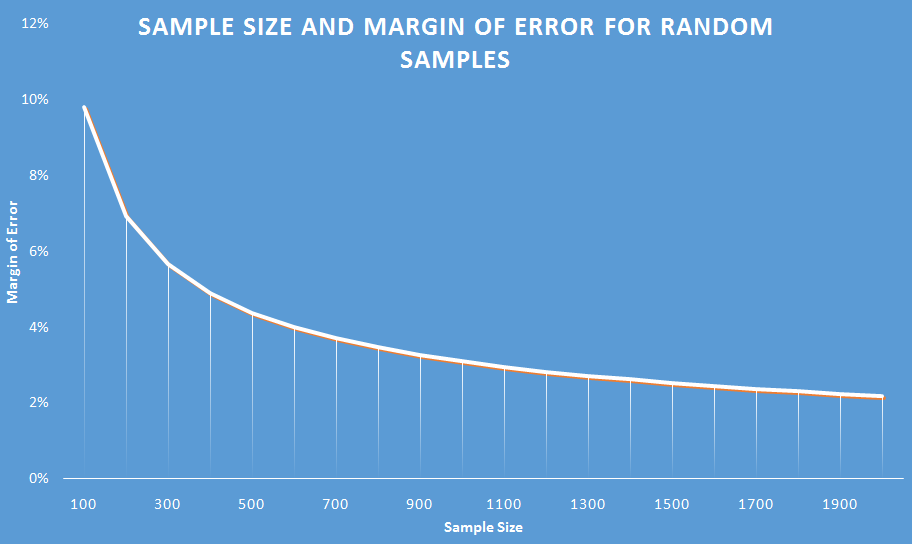
When random samples are used, there is always potential error that comes with using a sample. This happens even is the sample is a representative sample. The larger the representative sample, the smaller the error. However, we should note two important caveats. First, in highly competitive elections, polls may have less predictive value but can still provide critical insight into how voters are making decisions. Second, it would be a mistake to confuse large sample size with greater accuracy (even when the sample is randomly selected) as other types of error---including question wording and non-response biases--may also influence the results. Reputable pollsters attempt to minimize error from each of these potential sources.
Online surveys that use non-random samples but that match to back to population characteristics to achieve representativeness are increasingly common. Some of these surveys appear to perform relatively well when compared to final election returns but the jury is still out on the overall quality of these surveys and the best practices for assuring representativeness. This doesn't mean these surveys are necessarily wrong, only that we are less able to gauge whether they accurately represent the general population.
How we get to populations of interest is especially interesting. In election contexts, we are primarily interested in voters rather than the general population or all eligible voters. For folks who study voters, we either place a screen on the front end of the sample or use a series of questions to identify voters. There is a good bit of art in this process. So let's suppose we're going to survey Republican primaries for president. In 'closed' primary states (those using party registration), we can first select those who are potentially eligible to participate (registered Republicans) and then hone in on people who are likely to vote based on past voter history (the infamous '5-for-5 voter,' for example). Or, we could contact a sample of registered Republicans, and ask a series of screening questions about their likelihood of voting in the upcoming primary.
In open primary states, the task is a bit more daunting. We can look at voter histories and identify people who usually voted in a party's primary in the past. But, because the potentially eligible population is broader, we might be better served using screening questions to try to determine whether the individual is likely to vote and then whether they are likely to cast a ballot in the Republican or Democratic primary.
Finally, there is the question of who is asking. Different polling shops have different reputations for both accuracy and bias. Modern technology has made it easier to both craft and deploy surveys, and to disseminate the results. Always look at who paid for the poll, and then ask yourself who is their client - is it a media outlet, a party, a candidate, a movement? Most professional pollsters, including those working for candidates or parties, want the most accurate data possible for their internal use but may only release favorable poll numbers publicly. These numbers can be important in setting the narrative for the race as told by the news media and for attracting fundraising support. Journalists see little need in covering uncompetitive campaigns and donors are unlikely to contribute much to likely losers.
Are These Attitudes, Beliefs, or Opinions? There are three different things that are taken as opinion when people express themselves. But, what is often taken as opinion is not opinion, but is instead a belief or even an attitude. What's the difference? An attitude is the readiness to act or behave a certain way. They can be deliberately formed, or be subconscious. And, they are often a source of bias in processing empirical information. A belief is what someone thinks to be true, even in the absence of empirical proof. An opinion is one perspective or understanding that might be informed by fact. But an opinion is not necessarily fact. Facts are distinguished from opinions in that facts can be objectively proven to have occurred. Increasingly in America, we argue over facts, despite the empirical proof.
Surveys often ask questions on topics people haven't given much (if any) thought. Rather than admit they don't know, survey respondents will often make up an answer on the spot. Aggregated across all respondents, these answers might look like meaningful opinions but they are mostly reactions to question wording and top of the mind considerations. Polls conducted earlier in the primary process, for example, are less likely to reflect meaningful attitudes as candidate support may mostly reflect name recognition. Moreover, because primary preferences are not anchored to partisan affiliation and because voters often aren't paying close attention until closer to the election, candidate preferences during primaries can be more volatile than general election preferences.
Polls Are Like Fish. Surveys of public opinion typically take place over two or three days; then the results can start to age. If the immediacy of information is unimportant, the aging of a poll is not of great concern. This is especially the case if the information sought is unlikely to change due to outside events. During political campaigns, however, the information environment is dynamic, so poll results tend to age quickly. Depending on the information of interest to the reader, an aging poll might still be useful. But, if you are following the horse race (who is leading an election in a hypothetical matchup) and want to know the support for candidates or issues in a dynamic environment, a poll grows less valuable as it ages. In some elections where voters have limited information about the issues and don't know the candidates very well, horserace polling may be useless within a day or two of being completed.
On the (Relative) Uselessness of Horse Race Numbers in General. Horse race coverage is the favorite use of polling data by journalists because horse races are an easy story: who is in first place? By how much? And how has that changed since our last poll? But the horse race itself tells the public nothing of substance, other than allowing those who back the frontrunner to chest-pound and allowing bandwagon voters to pile aboard. It does not offer explanations for why the change took place. Horse race coverage does not drill into beliefs, attitudes, or opinions to understand how candidates are set apart from one another. At best, horse race affords the opportunity for using polling numbers in a variant exercise of confirmation bias. Pundits and candidates make predictions about how short-term events might influence the changing shape of the horse race - so Donald Trump says something inflammatory, and the pundits look for a dip in his horse race numbers. Otherwise, the horse race numbers may be the least useful thing one can do with polling.
The Usefulness of 'Tabs'. The value of polling and opinion data is in the analysis of subsets and the relationships revealed by both sophisticated analysis (which tends to be inaccessible to journalists and the lay public) and simple analysis such as crosstabs. Crosstabs show how responses in one question distribute across categories or responses to another question.
Crosstabs (or Xtabs, or 'Tabs) are the stuff of magic for candidates and clients. Tabs allow the user of a poll to drill into how beliefs, attitudes, opinions, and preferences intersect in different subsets of respondents. Horse race data does age. But underlying information about how types of voters (based on attitude, or belief, or some group characteristic) respond to different issues or messages is of great use, even if the poll is aging. Journalists and message shapers don't throw away that data just because the race has entered a new lap.
Weighty Effects Worth Knowing About. Between 2004 and 2012 the public enjoyed a full onslaught of frequent poll releases. Multiple polling houses came forward, using a variety of survey modes and methodologies. Three effects entered the conversation about polling data: mode effects; house effects; and (related to both) weighting effects. Also, because polling in the last two presidential campaigns featured (rare) high profile primary failures and also predicted GOP losses for president, there was both skepticism about polling in general and a focus by some conservatives on uncovering 'bias' in the polls that showed Republicans doing badly (unskewing).
Mode effects are "any influence on survey responses that is due to the mode of data collection." The mode itself is the means by which information has been collected - in person, live caller, voice recognition call, internet sampling, and mixed landline / cell live caller polls. The mode matters as poll respondents are less likely to admit to sensitive behaviors or attitudes when talking to a live interview. In 2008, pollsters worried that polls might fall victim to the Wilder (or Bradley) Effect, meaning they would overstate support for President Barack Obama as a minority candidate. In 2016, Donald Trump receives more support on surveys conducted online than on surveys conducted by telephone, suggesting Trump may have some supporters who do not want to admit it during a live interview.
A house effect is the combination of mode, sampling, weighting, question design, and instrument design that is found in a pollster's operation. Some polls exhibit particular biases toward one party or another, one ideology or another, one subset of the population or another. Sometimes the way they ask things lead to greater or lesser rates of response, greater or lesser 'don't know' responses. Often, when pooling data from multiple surveys in larger omnibus analyses of polls, we have to account for (or attempt to isolate) potential house effects. When we understand that certain polls have noted Democratic or Republican biases, we can better assess the meaning of their results. The presence of house effects does not, however, mean that poll results cannot provide useful insight into whether the race is tightening or widening, or into the sources of support for specific candidates.
Weighting effects are the shifts seen in the results of a poll that come from giving more or less weight to subsets of respondents. One thing we know about phone polls in particular and polls in general is that they are disproportionately answered by old or middle-aged white women. But, most of the country isn't old or middle-aged white women. Weighting to give more 'power' to responses of underrepresented groups in the electorate is supposed to correct against this problem. The challenge in weighting is knowing what the likely composition of your potential electorate will be. If you have a recipe for the electorate that is too heavily minority or too young or too urban, you induce a Democratic or liberal bias. If it is too rural or too suburban or too heavily Gen-X, it induces a Republican or conservative bias. It is in the recipes of weighted samples that pollsters have recently come under fire. So, critics will attempt to 'unskew' the polls by correcting the recipe in order to show the 'real' political environment. In 2012, Republicans incorrectly believed that the electorate would look more like 2004 and less like 2008; and, subsequently, that Mitt Romney had a much better chance of winning the election.
Why Polling and Pollsters Still Matter: Polls are not infallible, and quality polling is increasing difficult and costly. Yet, polls remain an indispensable component of any election campaign because they provide candidates and consultants with strategic and actionable information. Candidates can learn where resources are most needed, how best to mobilize existing supporters, and how to better appeal to potential supporters and swing voters. Moreover, polls are critical to journalists working to tell the story of the campaign. In the absence of polls, reporters often rely on unrepresentative "person in the street" interviews. Finally, other expressions of public opinion from social media posts to letters to the editor to attendance at public forums are biased in favor of the most intensely partisan citizens. Less intense partisans, moderates and independents are under-represented.
Overall, polls inform elected representatives about citizen preferences in ways that elections, letters to the editor, and individual conversations cannot. The process may not be imperfect and getting the polls right may be increasing difficult but, on balance, polling strengthens democratic responsiveness. Despite all of these issues in achieving a representative sample, we have yet to devise a better method for understanding what citizens are thinking and why they think that way.