Amid the oil leaks, athlete/celebrity/politician scandals and partisan recrimination it is easy to lose sight of the pillars that support everyday economic life. Five central pillars of our economic existence are jobs, wages, benefits, credit and housing. This article and graphs just check in to see what condition our condition is in. It is hard to assess where you need to be going if you can't tell where you are.
Consumer spending accounts for about 70% of US economic activity, GDP. American consumer spending represents about 13% of world GDP. What condition the US consumer is in turns out to be very economically important. If that leaves you cold, you might find added interest in the fact that these numbers serve as the best predictors of the electoral success/failure in November. Hostility to immigrants, government and each other tends to ebb and flow with economic fortune. Opportunity and prosperity are social ties that bind in good times and get frayed under tough economic conditions. I last wrote to you in a similar vein 2 years ago. I don't think I was wrong then?
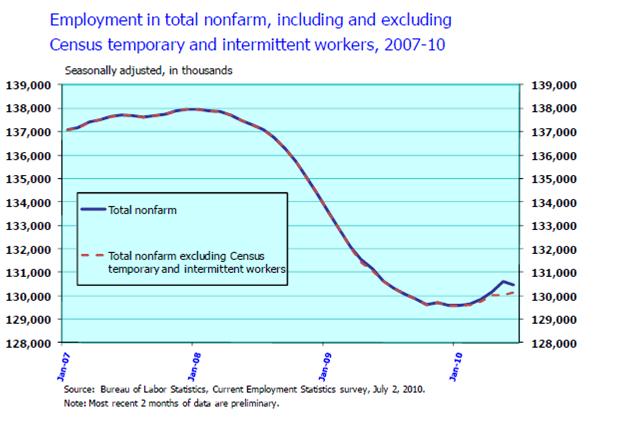
The above graph from the Bureau of Labor Statistics (BLS) details what you know. We are missing about 8.5 million jobs. Over 8 million jobs we had in late 2007 are no longer with us. Over the last two and half years our population has increased by 5 million people. We are missing almost one job for every man, woman and child in the state of New Jersey. Job losses are not evenly spread across regions, professions, genders, ages or ethnic backgrounds. About 6% of the folks who were working in 2007 have lost their jobs. With job losses we expect and have gotten losses in health insurance, pension coverage, tax payment and civic engagement. In 2009, US Government tax revenues were $463 billion, 18%, less than revenues in 2007. We have seen average hours worked and average hourly earnings decline. The below graph, also from the BLS, details the decline in average hourly earnings (AHE) and compares it to the CPI-U measure of price changes in urban areas.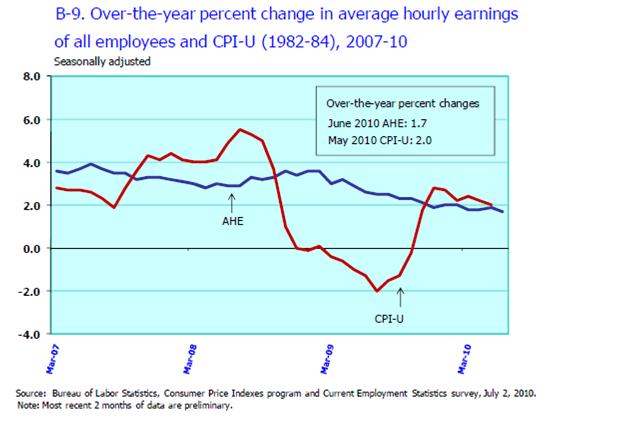
Average hourly earnings (AHE) are up less than the increase in prices (CPI-U). This tells us that we are able to afford less with our salaries. To this we must add that we have lost hours, jobs and benefits and that these losses are not reflected in raw job loss numbers. The average duration of those presently unemployed is 32 weeks. This suggests loss of skills, hope, erosion of savings and severe distress in millions of households. Whatever the GDP number are telling us, many families, communities and towns are depressed. Prices may be flat, but wages are flat. Jobs, hours and raises are hard to find.
Benefits
A third of the average American's compensation comes in the form of benefits. We earn an average of $29 for full time work and $9 of this comes from benefits. Most famously this includes health insurance and retirement assistance. Benefits include sick days, paid leave, breaks, work conditions and other perks. 13% of the total compensation given to Americans comes from health and retirement benefits. We will concentrate on health insurance and retirement assistance. 86% of Federal, state and local employees have health and retirement benefits and 60% of private sector employees have health and retirement benefits.
The vast reduction in state and local employment going on will lower the population with full benefits. 20% of Americans receive no health benefits and no retirement benefits. 15% of Americans receive either health or retirement benefits but not both sets of benefits. You will be shocked to learn that part time workers and those with the lowest salaries are far more likely to have neither medical nor retirement benefits. 68% of workers earning in the bottom 25% by income are missing health insurance, retirement benefits or both. Millions have seen benefits cut or reduced over the last few years. The newest data suggests that large and medium businesses reduced health and pension benefits by several percentage points over the last 2 years- in addition to millions of people leaving employment. Rising co-pays for medical treatment and erosion of coverage are reductions in pay. Likewise, declining options and reduced matching into 401k plans are reductions in compensation. Benefits are under pressure and have been for several years.
Credit
Consumer credit has been the first, last and intermediate option for millions of American households since the early 1990s. People have used credit cards, mortgage loans, refinancing, pay day lending, and friends/family to borrow. This was done as access to greater amounts of credit and historically low interest rates became substitutes for savings and social assistance programs. We saw vast, and vastly excessive, reliance on credit in each downturn since 1991. This pattern has broken and is presently running in reverse. The below graph illustrates the sharp recent decline in consumer credit. 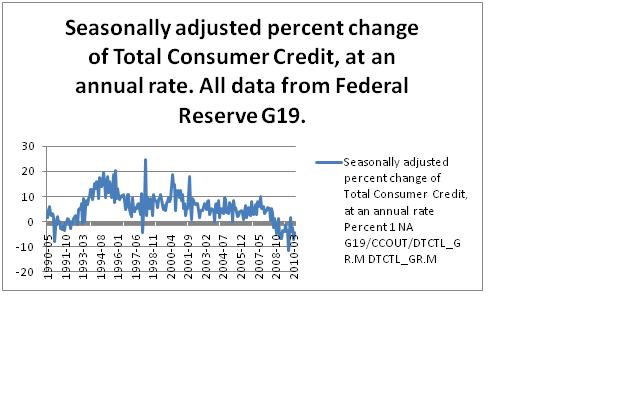
We have seen non-housing credit available to American households fall further and longer than ever before over the last few years. Mortgage borrowing has followed a similar pattern and is presently $250 billion below where it was in 2008. Less credit is available to American consumers and they are taking advantage of less of the reduced credit available.
Yesteryear's coping strategy- increasing consumer debt- has become a limiting factor. Credit is not going to be the crutch on which we hobble forward during this difficult economic period. Millions of households are struggling to repay old loans and the net stream of new loans has been negative for 2 years. Banks are worried about lending and have balance sheets bloated with deposits that they are not interested in lending. Low rates, loads of bank cash and few loans define the world of American housing.
Housing
Residential real estate remains the slow emergency of the US economy. I wish I could tell you that a lot has changed since 2007. As the first time home buyer's credit abates, housing has shown clear signs of weakness. Over 18 million US residences are vacant. An inventory of unsold homes sits on the market that could satisfy all present housing demand for 10 months. We have built a huge shadow inventory of houses off the market that will be added if/when home prices rise.
Foreclosure actions and delinquencies remain high. Realty Trac reported that more than 1.5 million residential properties received foreclosure and delinquency notices in the first 6 months of 2010. Foreclosure rates were up in 75% of urban areas over the first 6 months of 2010. Of late, banks are selling more houses than new home builders and this tells us clearly that the market remains defined by serious problems. All of this suggests that the tough times for housing and American households are not nearly over.
The below Federal Housing Finance Agency graph clearly displays the recent trend in US home prices. Leading mortgage servicers and industry experts continue to report over 7 million mortgages are either delinquent, in default or in the foreclosure process. More than 9% of US mortgages are not current as this goes to press.
Federal and private programs to assist those in or near default remain limited in scope and success. Recent reports on the success rates of government efforts suggest that slow progress is being made. Private modifications continue to fail more often than they succeed. A fraction of those in need are enrolling in assistance programs. These programs are slowly improving. We have learned that principle reductions and programs that address issues with credit card and auto loans as well as mortgage debt have higher success rates than programs that lower interest rates and extend loan durations. 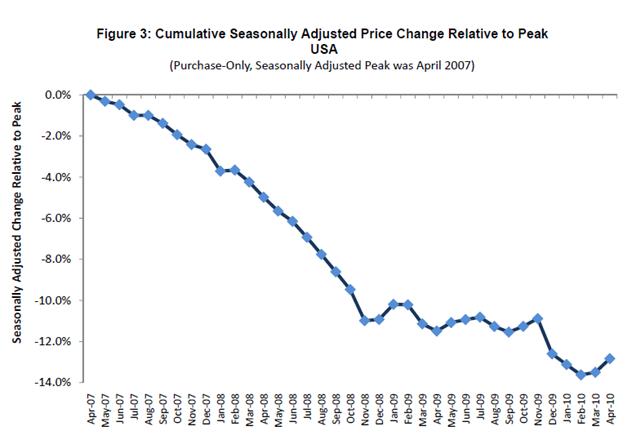
The bottom 75% of US households are experiencing real and long lasting economic distress. The numbers above do not capture people's pain, plans changed, dreams deferred. The artistic community does a far better job of speaking to the individual, community and personal damage that a violent business cycle creates.
A sense of what is going on must include an understanding of the economic landscape. To understand where to go, you have to know where you are. To make sense of the intensity of feeling on immigration, government, Wall Street, politicians, state workers, and taxes we must know the landscape of debate. That is what this article tries to do. It tries to provide us with a handy arrow that says- economically- we are here. Its important to check in and see what condition our condition is in.
Endnotes
Congressional Budget Office, The Budget and Economic Outlook: Fiscal Years 2010 to 2020. P.126
Program Perspectives, Bureau of Labor Statistics July 2010. Volume 2, Issue 4.
EBRI Data Book. The Employee Benefit Research Institute. April 2010. Chapter 4.
Realty Trac. 15 July 2010. http://www.realtytrac.com/contentmanagement/pressrelease.aspx?channelid=9&itemid=9555
29 July 2010. Bloomberg. http://www.bloomberg.com/news/2010-07-29/foreclosure-filings-rise-in-75-of-u-s-cities-as-joblessness-hurts-owners.html
Federal Housing Finance Agency News Release June 22, 2010. Figure 2.
Housing Wire (Housingwire.com) July 06, 2010 and June 01, 2010.