Among the most dramatic findings reported in the Census Bureau's Current Population Survey (CPS) is a large decline in turnout rates among young people, particularly those who were first eligible to vote in the 2012 election. In contrast, older persons' turnout rates remained steady, or even increased. Given the large disparities in support for Obama among younger and older voters, Obama's smaller margin of victory in 2012 was thus partially a turnout story, as the electorate's composition was older, and more favorable to Republicans in 2012 compared to 2008.
Younger people are less likely to vote, a pattern evident in all election surveys. These younger people may thus benefit from campaigns' mobilization efforts to register and encourage them to vote. These mobilization efforts, like much else in presidential campaigns, are concentrated in the closely fought battleground states -- which I define here as Colorado, Florida, Iowa, Nevada, New Hampshire, North Carolina, Ohio, Virginia. The turnout rate decline from 2008 to 2012 may thus be expected to be lower among the battleground states, particularly for younger people.
Failing to Mobilize the Youth Vote
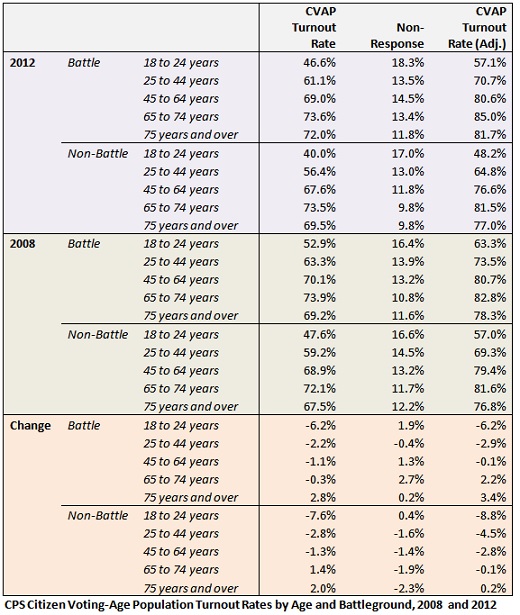
Below, in a methodology section, I argue that the adjusted citizen-voting-age population (CVAP) turnout rates, in the far right column under "CVAP Turnout Rate (Adj.)", the most reliable to assess patterns in youth vote. I provide the unadjusted turnout rates under "CVAP Turnout Rate" as a reference, but I will only discuss the former. Turnout rates in 2008 and 2012 are presented for various age categories in both battleground and non-battleground states. I discuss overall national rates here.
The key statistics in the table is that turnout rates among the youngest people, for whom the 2012 election was their first election, declined in both the battleground states and the other states, by 6.2 percentage points and 8.8 percentage points, respectively. Conversely, turnout rates for older people actually increased between 2008 and 2012, even more so in the battleground states.
Since 2004, younger and older people hold increasingly different preferences over Democratic and Republican candidates. Obama's lower national vote margin in 2012 compared to 2008 can thus be understood as a turnout story, with an important Democratic constituency removing themselves from the electorate and an important Republican constituency reemerging.
The Obama campaign appears to be only marginally successful at counteracting youth disengagement through their mobilization efforts targeted at the youngest people in the battleground states. A significant challenge thus lays before Democrats in 2014 and beyond: they will need to double their mobilization efforts to target not only young people entering the electorate since 2012, but also those who failed to participate in 2012. And for Republicans, there is an opportunity: abstaining young voters have not staked a partisan attachment yet and may still be persuaded to vote for Republican candidates if first mobilized by Republicans.
A Survey Methodology: A Digression into Non-Response Bias
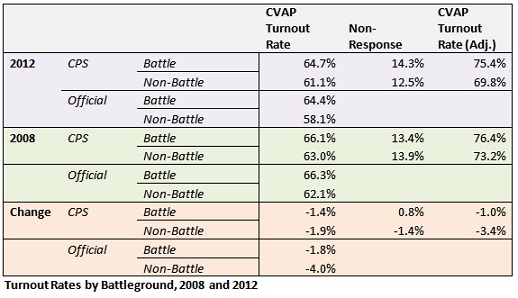
Aggregate voter turnout statistics compiled from official election results demonstrates the turnout benefits that accrue to battleground states. Between 2008 and 2012, the presidential turnout rate for those eligible to vote declined 1.8 percentage points in the battleground states (from 66.2 percent to 84.4 percent). In the other states, turnout rates declined 4.0 percentage points (from 62.1 percent to 58.1 percent).
The aggregate statistics do not reveal turnout patterns among age groups. For that, we need to examine survey data. Of course, there are errors in survey data. Some are well-known, such as the margin of error that arises from statistical sampling. Less well-known issues that survey researchers wrestle with are over-report and non-response bias. Over-report bias is a phenomenon whereby more people report voting than the official statistics indicate. While it may be tempting to think of these people as lying, by trying to portray themselves in a favorable light to the interviewer, the actual mechanics are not perfectly understood. A potential related issue may be over-report bias, that those who choose to participate in a survey are generally more participatory people.
The Current Population Survey is generally regarded as a high-quality survey. Its primary purpose is to calculate the monthly unemployment rate. The Census Bureau goes to great lengths to ensure that those who are selected to be in the sample respond to the survey, to mitigate potential non-response bias. However, people may still choose not to answer specific questions, particularly those in the voting and registration supplemental questionnaire, which is administered in the November of a federal election year. Indeed, the supplement may not even be administered to a respondent.
Non-response is a serious issue, with 12.8 percent of CPS respondents failing to respond to the vote question in 2012, which was slightly lower than the 13.8 percent in 2008. While the higher response rate in 2012 is welcome, that does not necessarily mean that all respondents improved their responsiveness in the 2012, as we shall see. Furthermore, the CPS's practice is to include non-respondents as having not voted, even those who were never administered the supplemental questions. That's right. A person who was never asked the voting question is marked as having not voted. A more reasonable approach would be to exclude these people from the turnout rate calculations.
With this in mind, over-report bias and non-response bias are clearly evident among the CPS voting questions. For example, in 2012 the presidential turnout rate among those who were eligible, according to the actual vote tallies, was 58.7 percent, compared to 63.6 percent, according to the CPS. The CPS over-report bias is more severe when non-respondents are removed, with 70.9 percent reporting having voted.
Even though over-report bias may be present, the CPS still provides valuable information. We can see, for example, the expected pattern of turnout decline among battleground states and other states, with the CPS indicating a 1.4 percentage point decline among battleground states (1.0 points when non-respondents are removed) compared with 1.8 percentage point decline using the official election results. The decline among non-battleground states is 1.9 percentage points for the unadjusted CPS turnout rates, 3.4 percentage applying the non-response adjustment, and 4.0 points using the official statistics. With the official election results as a validation point, the CPS turnout rate adjusted for non-response thus appears to be more valid than the unadjusted turnout rate.