
A popular position among polling analysts these days is to avoid getting hung up on any single public poll's demographics or party identification distribution. Throughout the recent debate over skewed (and unskewed) polls, the standard has become to sidestep analyzing any individual result in favor of the aggregate. The New York Times' Nate Silver built his reputation on this -- using a computer model based on polling averages to avoid getting hung up on any individual result. Meanwhile, other reporters -- like The Washington Post's Chris Cillizza -- have grown tired of hearing partisan spin about why the party identification composition of individual polls may be biasing (Cillizza recently pleaded for no more party ID tweets).
But like most pollsters when a new poll comes out, I generally cannot help but look at metrics like party identification and other more immutable demographics. Recently, I have been struck by the huge variations in age distributions of many public polls -- especially at the state level. For example, in Colorado, a September CBS/NYT/Quinnipiac poll suggested a likely voter electorate where seniors (those ages 65 and up) made up 36 percent of the electorate. Purple Strategies released a poll with seniors at less than half that (15 percent). The NBC/WSJ/Marist poll had it somewhere in the middle. The point is this -- the results being produced by different pollsters are coming to very different conclusions on the age distribution of the likely electorate.
Why does age matter? Because almost every publicly available data point shows that age is a significant demographic driver of preferences in this presidential election. In Gallup's most recent aggregate data release that includes nearly 10,000 interviews, Romney leads among those 65+ by six points while Obama leads 18-29 year olds by 26 points.
AGE & TURNOUT: REMARKABLE CONSISTENCY
While much has been made of increased youth enthusiasm in 2008 and the potential for a decline in participation in 2012, a look at past data shows that a major shift in the percentage of youth voters or seniors is unlikely this November.
To examine this point, the following tables pull age data from two data sources -- exit polls and voting studies conducted by the Census Bureau every two years since 1996. (Note this is not the decennial census but a separate study conducted specifically on voting).
While many rely only on exit polls for this type of analysis, a study conducted at my firm, Global Strategy Group, found that these Census surveys more closely align to the real data found in voter file databases available to many campaigns and pollsters. These databases are comprehensive and include records of vote history along with demographic information on nearly every voter. For example, in Colorado, we can look at a voter file filled with demographics on 2.38 million people who voted in 2008 out of the 2.40 million who actually voted that year. However, voter files begin to break down as you look more than a few elections back and are not publicly available for all to see and analyze. Therefore, I am relying on the Census studies and exit polls in this column.
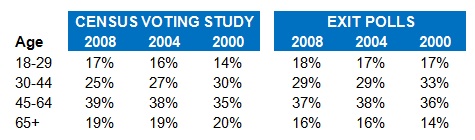
Whatever the preferred data source, what we find is a remarkable level of consistency in turnout by age relative to what we are seeing from public pollsters. In the last three presidential elections, seniors have made up 19 to 20 percent of the national electorate in the Census studies and 14 to 16 percent in the exit polls. The share of the youth vote increased from 2000 to 2004 to 2008 in both data sets, but by very modest amounts (The left column represents the 'Census Voting Study' and the right column represents the 'Exit Polls'):
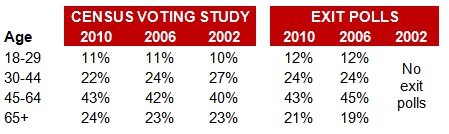
In midterms -- where turnout is lower across the board -- seniors rise by about five points in each data source, while the share of 18-29-year-olds drops by around that amount:
And in the states? A deeper look at two swing states, Colorado and Florida, find similar patterns. According to the 2010 decennial Census, Colorado is one of the youngest states in the union. At 14 percent of the voting age population, Colorado has the fifth fewest amount of seniors 65+ of any state -- the lowest of any of the swing states (only the non-swingy states of Alaska, Utah, Texas, and Georgia have fewer seniors). Meanwhile, Florida is the oldest state in the country with 22 percent of its voting age population 65 or older. Here's four years of Census voting study data on these states (excluding 2006 which is not available on their web site):
*NOTE: Census only provides 18-24 breaks at the state level. 18-29 percentage extrapolated using both state & national data.
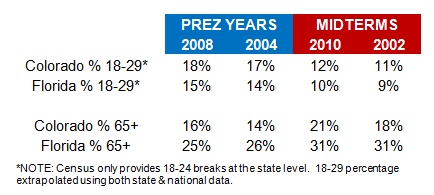
Here we see some very modest variation at the state level, but the bigger story is again consistency. There is variation between presidential years and midterm years. And there is variation between Colorado and Florida. But in comparing the same type of election within the same state, the differences are no more than a point or two.
2012: OLDER THAN 2010?
I included the midterm data in the charts above to give an idea about what might be an extraordinarily high percentage of seniors (or low percentage of 18-29-year-olds) in 2012. It is a fairly safe assumption that the 2012 electorate will be higher turnout and younger than the 2010 midterm electorate. Put another way, there is no historical precedent that 2012 will be older and lower turnout than 2010.
Yet a quick tour through some recent public polls suggests many public pollsters are producing samples that are predicting the virtually impossible -- and in some cases showing turnout estimates that are even older than the 2010 midterms. Some examples are as follows:
- The mid-September CBS/NYT/Quinnipiac survey in Colorado put the share of seniors 65+ in their poll at 36 percent -- 15 points above the Census' 2010 estimate and 20 points above their 2008 estimate. On the same day, they released polling in Virginia showing seniors at 23 percent and Wisconsin at 25 percent (still too old for those states but much closer to reality). Their conclusion was Colorado was a tighter race than the other two states. But there is reason to doubt that conclusion given the Colorado poll's age distribution and the fact that the Colorado poll showed Romney leading seniors by 10 points but trailing among those 18-49 by nine points.
- A September poll in Pennsylvania by Susquehanna Polling and Research put Obama up by just two points -- a significant outlier compared to other results released at the same time. That poll had 18- to 29-year-olds at 7 percent. But the Census voting study data in Pennsylvania put 18- to 29-year-olds at 19 percent in 2008 and 11 percent in 2010. Estimating 18- to 29-year-olds at 7 percent of the electorate suggests that youth share of turnout in 2012 will be even lower than in 2010.
- Other pollsters don't show weighted age distributions and just provide unweighted sample sizes. A September poll in Michigan by Foster McCollum White Baydoun put the unweighted break for 66+ at 44 percent while just 3 percent of their unweighted interviews were 18-30 years old. The census data for Michigan estimates that 19 percent of 2008 voters were 18-30, suggesting a huge under-representation of 18- to 30-year-olds in their sample (unless they weighted up their 18-30 year old sample by an enormous amount). That poll showed Obama +2 which was a significant departure from other polling in Michigan at the time.
NOTE: Both Susquehanna and Foster McCollum released data this week showing similar age distributions and similar slim Obama leads. It remains to be seen how both firm's more recent poll stacks up against other public polling in these states, so I have chosen to focus on the September data here where there are many more data points to compare.
All of these polls seemingly skew older and all of these polls have put out results that have been better for Mitt Romney than other polls released around the same time period. Note that these three polls are by no means alone in this -- many other pollsters produce samples that skew too old versus historical data, although often by more modest amounts.
Interestingly, many of the IVR polling firms out there -- like PPP and Purple Strategies -- put out younger age distributions that look more in line with historical age turnout data. PPP, for example, acknowledges the need to adjust for age due to the inclination of IVR polls to skew older without weighting. The fascinating thing is that recent analyses by Nate Silver and The New Republic's Nate Cohn show that IVR polls are producing more Republican-leaning results than live interview polls, despite weighting age to a more accurate representation of the likely electorate. This suggests that something else about these automated polls besides age is causing IVR polling to skew more Republican. It also suggests that the gap between a properly age-weighted live interviewer poll and an automated poll may be even larger.
CONCLUSIONS
There are three possible explanations for why a poll might skew too old:
- Cell Phone/Landline Distribution. The decision about the percentage of landlines and cell phones in the sample will have huge implications on the age distribution of a poll. According to an aggregation of nearly 15,000 interviews conducted by Pew over the last year and a half, calling random cell phone numbers would give you a sample that is 26 percent 18- to 29-years-old while calling random landline numbers would get you 7 percent 18- to 29-year-olds. That is an enormous difference and the way a pollster handles this decision has serious implications on age distributions. The problem is that there are no real standards in how to combine cell phone and landline data. On this topic, the editor of this page -- Mark Blumenthal -- said in a recent New York Magazine article said that "no one knows the right way to do this right now." Therefore, many pollsters are making somewhat arbitrary decisions about how to divide their samples that have a huge impact on age distributions.
Ultimately, every pollster is entitled to tackle these difficult challenges -- from cells vs. landlines to likely voter models to weighting techniques -- in their own way. They are also entitled to have different theories about whether younger voters may be less likely to vote this year as long as they are backed up in data and not pure conjecture.
But with declining response rates and increasing challenges in getting young voters to answer surveys, methodologies that produce age distributions too far from known historical standards need to be re-examined. Pollsters may face more challenges in getting a representative sample than ever before, but they also have more robust data sources at their disposal -- including voter file databases, exit polls, and the census voting studies cited in this article. I would encourage more pollsters to rely on this data.