
Analysts have viewed the passage of Obamacare (the Patient Protection and Affordable Care Act) on March 21 through the lens of partisan, racial, and regional conflict. Democrats voted for the bill. Republicans did not. Northern states voted for the bill. Southern states did not. Black and Hispanic representatives voted for the bill. White representatives split their votes.
Indeed, if one focuses on geography and history, the numbers do paint a stark picture of regional division and recrimination, one that seems to override political interest and logic. The Southern States, which are among the poorest states in the nation, possessing the least robust insurance coverage for their populations, would logically benefit the most from the health care reform legislation. However, Southern House representatives voted most strongly against the legislation.
I would like to suggest, however, that the reality is more nuanced. Let's first examine the votes at the state level. Did these votes conform to or contradict the practical interests of the states with respect to insurance coverage?
Explanation I - Regional & Partisan Antagonism
One simple way to answer this question is to measure state insurance coverage levels against national averages. In 2008, private insurance covered 69.6 percent of the US population. Presumably, the health care reform legislation would benefit states where private insurance covered a lower percentage of the population. It would be in the interest of their Congressional representatives to vote for the bill. The converse would hold for states with private insurance coverage higher than the national average. It might be in the interest of their representatives to vote against the bill.
Of the 50 states, 31 voted against their interest. In other words, a majority of the representatives in these states voted against the bill even though private health care insurance covered a lower percentage of their state's population than the national average. Or a majority of the representatives in these states voted for the bill even though private health care insurance covered a higher percentage of their state's population than the national average. The remaining 19 states either split their votes evenly or had majorities that voted in a manner "consistent" with their interest as a state.
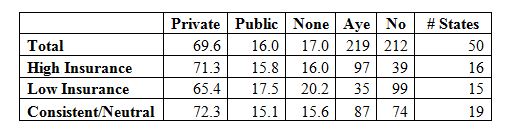
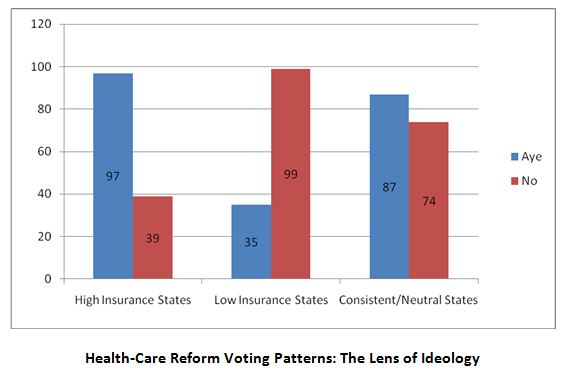
Let's call states voting for the health care reform bill, in defiance of their objective interests, High Insurance States. Within these states, 97 representatives voted Aye and 39 voted No. Of the 16 states in this category, none are from the South (hence another meaning for "high"). Within these states, 71.3 percent of their residents have private health insurance coverage, against the national average of 69.6 percent.
Let's call states voting against the health care reform bill, in defiance of their objective interests, Low Insurance States. Within these states, 35 representatives voted Aye and 99 voted No. Of the 15 states in this category, 12 are from the South (with a second meaning for "low"). Exceptions are Alaska, Idaho, and Montana, with only 4 of the 134 votes. Within these states, 65.4 percent of their residents have private health insurance coverage, against the national average of 69.6 percent.
Explanation II - Economic Class and Economic Interest
While this state-level data would seem to confirm the presence of powerful regional antagonisms, the reality is more complex at the level of Congressional district voting patterns within states. What the data reveals at the individual district level is that economic class and economic interest affects voting patterns in a manner that cuts consistently across regional boundaries.
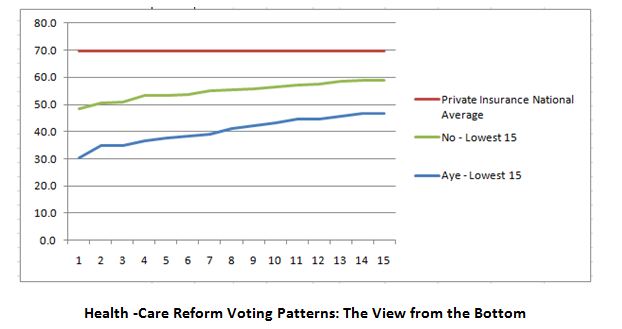
Consider the districts with the lowest levels of private insurance coverage. All 15 representatives from Congressional districts with the lowest rates of private insurance coverage, ranging from 30.2 percent to 46.7 percent, voted for the health care reform legislation. By contrast, the 15 Congressional districts with the lowest rates of private insurance coverage that voted No on the legislation were significantly better off - with private insurance coverage rages ranging from 48.6 percent to 59.0 percent.
Likewise, of the 15 Congressional districts with the highest rates of private insurance coverage, ranged from 85.5 percent to 89.7 percent, 11 representatives voted against the legislation and 4 voted for the legislation. Interestingly, none of these 15 districts are in Massachusetts, which, while lowering rates of uninsured to historical lows, offsets these lows with high levels of citizens covered by public insurance. The conclusion is that economic interest does predict voting outcomes on the Health Care Reform bill.
If we return to our three statewide classifications - Low Insurance and High Insurance states voting against their interest and Consistent/Neutral states voting with their interest - class difference and class distinctions also govern internal voting patterns at the Congressional district level.
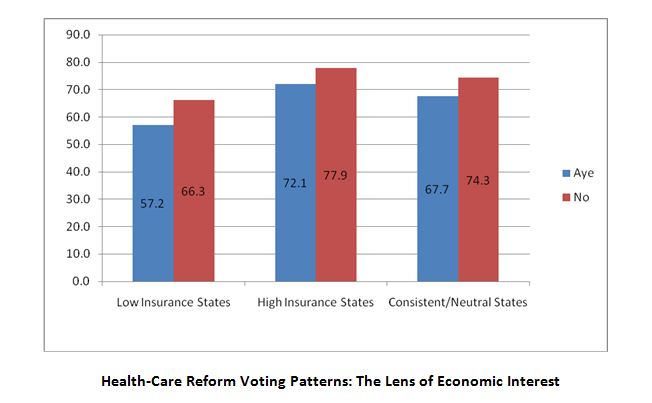
In Low Insurance States, the representatives who voted No had private insurance coverage rates averaging 66.3 percent. The representatives who voted Aye had districts with private insurance coverage rates averaging only 57.2 percent.
In High Insurance States, the representatives who voted No had private insurance coverage rates averaging 77.9 percent. The representatives who voted Aye had private insurance coverage rates averaging 72.1 percent.
In Consistent/Neutral States, the representatives who voted No had private insurance coverage rates averaging 74.3 percent. The representatives who voted Aye had private insurance coverage rates averaging 67.7 percent.
In every voting category - in states, largely from the South, that opposed the legislation ideologically; in states, largely from the North and the West, that supported the legislation ideologically; and in states, dispersed throughout the nation, that opposed or supported the legislation pragmatically - representatives from districts with lower levels of private insurance coverage consistently supported the legislation while representatives from districts with higher levels of private insurance coverage consistently opposed the legislation.
Conclusion - The Politics of Health-Care Reform
Can we view the opposition to Health-Care Reform from states that should, objectively, have supported it as a Tempest in a Tea Party? Only to a point. Obviously, the Republican Party voted as a bloc, and the Republican Party is strongest in the Southern and Western states. Memories of Tea Party shenanigans during the August recess may have contributed to this unified front.
Nonetheless, the voting patterns at the Congressional district level, when mapped to insurance coverage rates, clearly indicate that, within both "Low" States and "High" States, economic interest influenced voting outcomes.
The pull of interest suggests that, with the issue of health-care and with other issues such as tax policies that influence the economic well-being of Americans, the Republicans cannot assume they will carry an advantage in economically disadvantaged parts of the nation by waving the bloody shirt of regional division and cultural separation.