
One of the most striking--and perhaps most underreported--aspects of the financial crisis is reflected in one economic indicator. The chart below tracks this indicator over the last 90 years. One sees a spike to the left of this timeline, and a spike to the right, with a long dip, and a steady increase over time. Looking at this chart, and knowing that the rise on the left occurred in 1928, and the rise on the right occurred in 2007, one might assume that tracking this indicator might provide some insights into what caused the Great Crash of 1929, and our own Great Recession.
Table One: The Rich Get Richer (Source)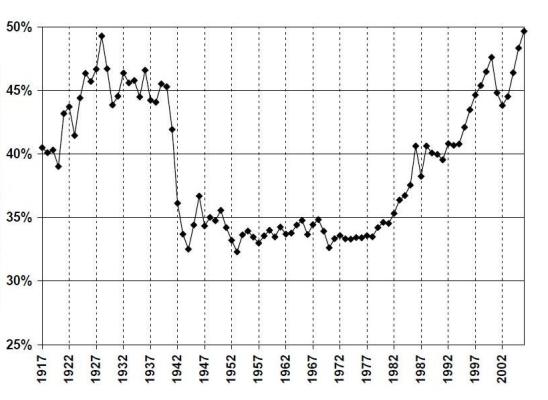
This graph represents the share of U.S. wealth enjoyed by the richest 10% of the U.S. population over the last 90 years.
Similarly, income inequality in the U.S., as measured by the GINI coefficient, the difference between the wealthiest and least wealthy in society, follows a similar trend. (See note on sources, below.)
Table Two: U.S. GINI Timeline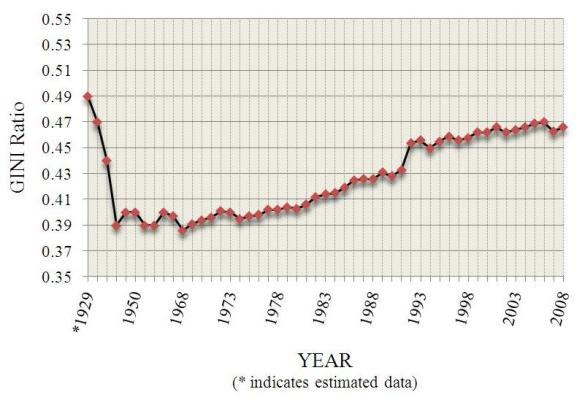
How bad is the U.S. GINI ranking relative to other countries? Nations with GINI scores similar to that of the U.S. include Ghana, Turkmenistan, Senegal and Cambodia. And we are way beyond the GINI ratio at which countries often face civil unrest.
State level data on income inequality actually reveals a potential connection between income inequality and the present foreclosure crisis, as the following graph shows. States that rank higher on an index of income inequality, on average, have higher mortgage delinquency rates. Of course, a graph with a trend line like this shows a positive correlation between income inequality and delinquencies: the higher a state ranked in terms of inequality, the higher its delinquency rate rank.
Table Three: Income Inequality and Delinquency Rates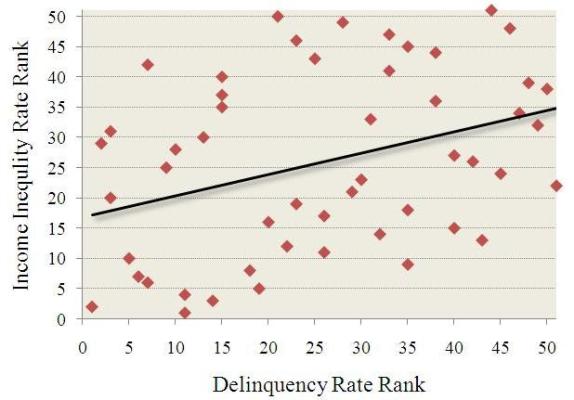
Is income inequality to blame for the Great Recession? There are several ways to try to explain the potential connection between income inequality and economic crises. Bruce Judson of the Yale School of Management describes a "Governance Problem," whereby the wealthy use their increased income to control the levers of power to further consolidate their advantages ("insulate, insulate, insulate" as Sherman McCoy might say). The history of financial sector deregulation over the last thirty years tracks this rise in income equality. And many of the economic gains over this period can be traced to the financial sector.
Table Four: Income in the Financial Sector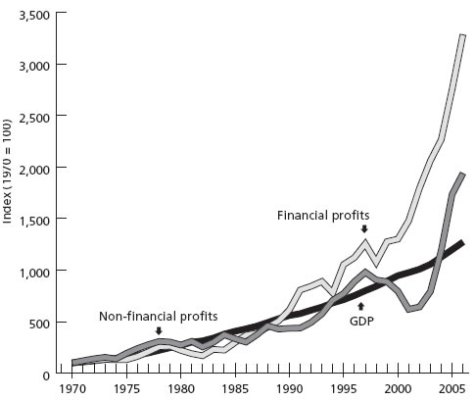
Another potential explanation for the possible connection between income inequality and financial crises comes from Raghuram Rajan, former IMF official presently on the faculty at the University of Chicago. In his recent book, Fault Lines, he argues that elected officials used easy access to credit to mollify low-income Americans, who might otherwise chafe at rising income inequality. He lays blame for the crisis with such laws as the Community Reinvestment Act (CRA) and the practices of the Government Sponsored Entities, Fannie Mae and Freddie Mac (GSEs). Unfortunately, this argument falls short of the mark. First, there is no connection between a state's poverty rate and its foreclosure rate, as the following graph shows. The flat line indicates no correlation between poverty rate and delinquency rate.
Table Five: Delinquencies and Poverty Rate Rank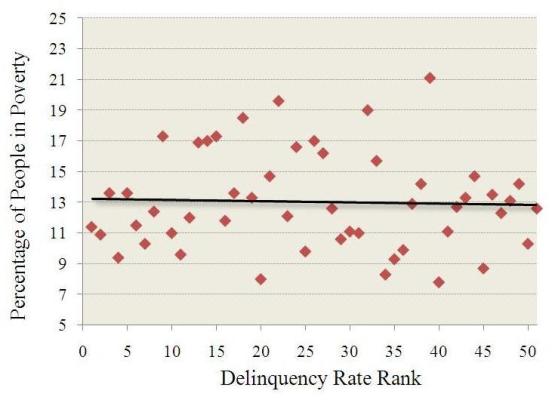
If risky lending was concentrated in low-income communities, as economists like Rajan and commentators like Neil Cavuto of Fox News have argued (who has gone even farther to say that it is low-income communities of color that are to blame for the crisis), we would see higher foreclosure rates in states with a higher poverty rate, but that is simply not the case.
And what about government laws and policies? Well, the CRA did not cover 94% of subprime lending during the height of the subprime mortgage frenzy of the last decade, so it is hard to lay the blame with the CRA when the overwhelming majority of risky lending occurred beyond its reach. Indeed, 169 subprime lenders closed their doors in 2007 after their business collapsed with the fall of the economy. 167 of them were not covered by the CRA.
And the GSEs?: a review of GSE practices during this period reveals two things. First, the GSE share of mortgage-backed securities actually diminished as the market for such securities grew, as the following graph reveals.
Table Six: GSE Subprime Market Share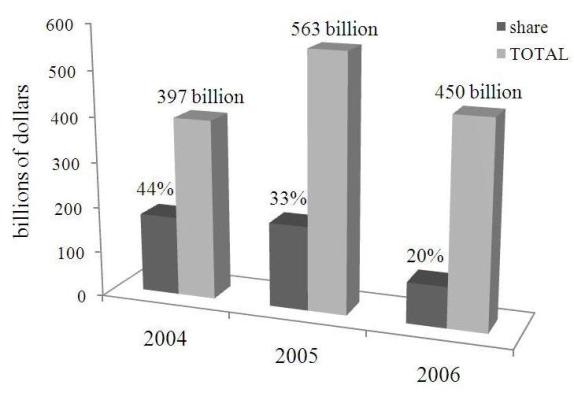
Furthermore, as recent research by the National Community Reinvestment Coalition indicates, the foreclosure rate of the GSE portfolio is actually half that of the portfolios of private mortgage-backed securities, revealing that GSE underwriting criteria were likely more stringent than those of the private market. This suggests that if GSE criteria had been used during the last decade, then the number of foreclosures--indeed, the foreclosure crisis itself--would be half as severe. It is hard to argue that GSE practices were to blame for the crisis when they had a diminishing share of the subprime securitization market as that market increased and their underwriting criteria were generally much better than those mortgages purchased on the private securitization market.
A third potential explanation for the lead up to the financial crisis is that income inequality creates what is called "social distance": a way of drawing distinctions between people. This social distance, in turn, leads to predatory conduct. When we perceive ourselves as different from others, we are not only less trusting of them but also more likely to seek to take advantage of them. As the following graph shows, in states considered to have higher levels of trust, those states also enjoy lower foreclosure rates.
Table Seven: Trust and Delinquencies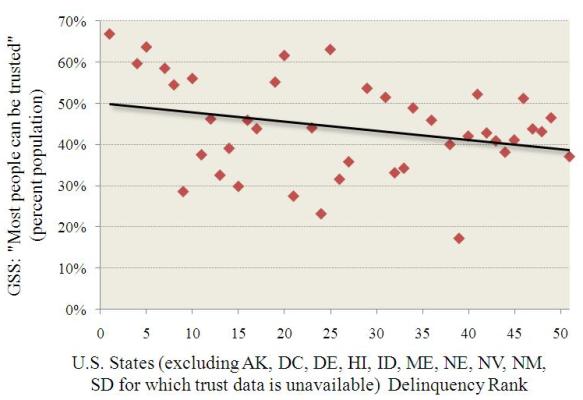
The theory of social distance suggests that social distance diminishes trust and increases the likelihood of predatory conduct. One measure of predatory conduct is a state's crime rate. As the following graph shows, there is an apparent negative correlation between states ranked by crime rate as compared to their rank in terms of the level of trust found in each state: that is, the higher the crime rate, the lower the trust in that state.
Table Eight: Trust and Crime Rates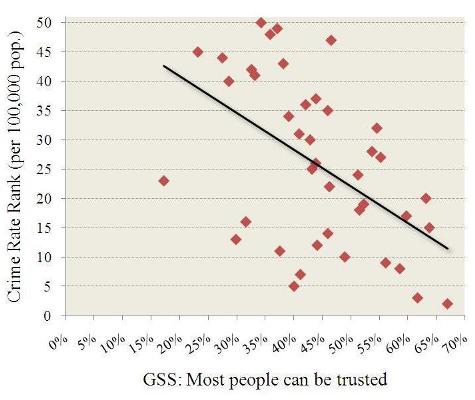
What's more, states with higher crime rates also have higher foreclosure rates, suggesting that communities with higher crime are also communities where predatory lending may have thrived. This correlation lends credence to the theory that one of the causes of the financial crisis was not risky borrowers, but, more likely, risky--and predatory--lending.
Table Nine: Crime Rates and Delinquency Rates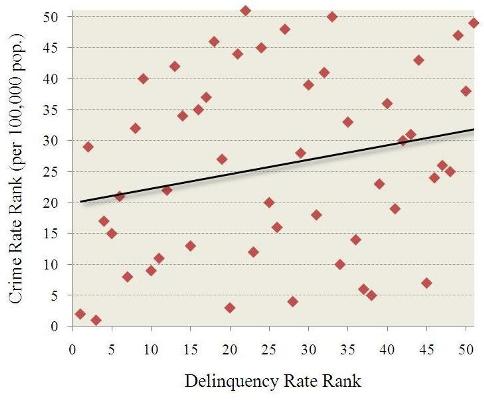
Did this higher crime rate mean it was borrowers engaged in fraud? Perhaps in some instances. But the FBI estimates that 80% of losses from mortgage fraud are due to banker misconduct. As one example, Congress unearthed a 2005 internal study conducted by Washington Mutual that revealed that 83% of the loans generated from just one of that bank's California offices involved some form of fraud on the part of bank officials.
Did income inequality lead to more predatory conduct in the form of predatory lending? Did this, in turn, steer more people, unwittingly, into loans they could not afford? The correlation between income inequality, levels of trust in states, crime rates and foreclosure rates certainly would suggest that these phenomena are not coincidental.
This correlation suggests that policy responses to the present crisis, and policies to diminish the risk that income inequality will lead to future crises, must take into account income inequality and the economic distortions it may cause. A task that is easier said than done, for sure. Campaign finance reform? Not on Chief Justice Roberts's watch. Higher taxes for the millionaires? Maybe that stands some chance in this political climate, but it will be quite a battle. And Congress is awash in an unrelenting torrent of corporate cash that would resist such efforts hammer and tong. The recently passed financial reform legislation requires changes in the way the financial industry does business in some respects, but it says almost nothing about income inequality, and its weak executive compensation provisions will not reduce the gap between the rich and everyone else.
Consumers need not wait for Congress to force banks to work closer to home, to reduce social distance and to have sustainable economic policies that are based not just on trust, but also on trustworthiness. In community after community throughout the U.S., thousands of community banks chose not to engage in risky lending practices, worked hard to generate trust in the communities they serve, and operated in a safe and sound manner. The Move Your Money campaign urges consumers to vote with their feet by patronizing those banks where social distance is lower and predatory behavior unlikely. With little relief for income inequality and the distortions it causes coming from Congress, a grassroots, consumer-led campaign that impacts bank bottom lines from the bottom up, that forces banks to improve their practices, or leads consumers to patronize only those banks that behave well, may be the approach that stands the best chance of success at getting at income inequality and the risks--and crises--it tends to generate.
A Note on Sources: Sources for the graphs in this article, where not indicated above, can be found in a draft of an article that is forthcoming in Volume 66 of the N.Y.U. Annual Survey of American Law, which can be accessed here. The delinquency data is derived from research compiled by the Mortgage Bankers Association.